
DataVisualizations @DataVisualizat5
Celebrating the best data visualizations every day. Joined January 2021-
Tweets0
-
Followers6
-
Following56
-
Likes0

María Dolores Chaira @MChaira
24 Followers 942 Following
jogress binro @lalalaland34
0 Followers 3K Following
Fatih Eldirdiri @eldiediri
21 Followers 427 Following
Saturnino Martínez �... @mandarrian
4K Followers 5K Following 🇮🇨 Sociólogo: educación y desigualdad social. Me encanta debatir con gente extremadamente educada. Asesor de Agenda Pública https://t.co/Ju3Qiu8W18
Tom D @tdelet
761 Followers 1K Following Curious. Problem Solver. Dad. Fintech Product. Likes: Innovation, Design, Data visualization, Better financial markets, Crypto. (Arculus Wallet)
Annie Shum @insightspedia
1K Followers 1K Following Data Scientist; Visualytics; Connect the Dots; Fractals; Data Visualizations & Analytics; Bigdata; Modeling Biological Aging & Healthspan AssuranceAnalytix @AndroidAnalytix
73 Followers 0 Following Analytix is an application for visualizing Google Analytics data near realtime(hourly view!!!) and is serving great and clean visualizations.
SML Viz @smlviz
208 Followers 0 Following Small, medium and large data visualizations / See also @smlinfodesign / Part of @smluniverse_org, the non-profit arm of @smluniverse
ExcelTV @ExcelTV
5K Followers 53 Following Excel yourself with Microsoft Excel - tips, tricks, tools, techniques and data visualizations for everyday analysts.
Visart @visartio
266 Followers 288 Following Visart turns data into visualizations without code. Providing you with interactive business & research dashboards. Tweets about #smb, #data, #BI & #analysis.
datavisual @datavisualinfo
501 Followers 394 Following Data visualization software for designers to easily make beautiful charts, graphs and maps. Publishing daily visualizations on current events.
fastml viz @fastml_viz
488 Followers 0 Following Data visualizations. Also see @fastml and @fastml_extra for machine learning and data science stuff. Profile image credit: http://t.co/ST5pI4N0Le
dashboardom @dashboardom
717 Followers 0 Following Data visualizations from interactive dashboards, brought to you daily, by @eliasdabbas
datagrapha @datagrapha
322 Followers 0 Following Visualizations of all kinds of data. Making data beautiful, viewable, and tell its story graphically :).
Silk Journalism @SilkJournalism
809 Followers 767 Following Silk is a free tool for data journalism. With Silk you quickly publish data online, analyze the information, then build interactive data visualizations.
DMN Interactives @DMNinteractives
274 Followers 283 Following Dallas Morning News interactive graphics, longform and data visualizations. Follow the team: https://t.co/McrCKNundU
J&M Stat Solutions @JMStatSolutions
226 Followers 608 Following We specialize in creating tailored, data-driven solutions; data technologies, predictive analytics and data visualizations. Email: [email protected]
WSJ multimedia team @WSJmultimedia
390 Followers 199 Following Multimedia news packages and interactive data visualizations from the staff of the @WiStateJournal.
World Bank Data @worldbankdata
81K Followers 406 Following The Development Data Group unlocks the value of #data for development. Follow us for #opendata news, stories & #dataviz. More: https://t.co/SYIZiT3mF6
HelpMeViz @HelpMeViz
932 Followers 0 Following Helping people with everyday data visualizations [email protected]
Infogrades @Infogrades
2K Followers 38 Following Understand the world through #infographics. Discover interesting facts, shocking statistics, history timelines, map infographic and amazing data visualizations.
Infographics Online @infographicsdir
926 Followers 4 Following The Infographics Directory is your source for infographics and data visualizations organized by topic and date so you can find relevant and timely infographics.
Kateryna Artyushkova�... @scimomof2
1K Followers 2K Following A surface analyst with a passion for data analysis and visualizations. Vacuum rocks! North American Editor of Surface and Interface Analysis Journal.
Globe Data Desk @GlobeDataDesk
599 Followers 46 Following Data journalism and visualizations from the @BostonGlobe and elsewhere.
Jan Žák @zakjan
766 Followers 676 Following Software Engineer / Consultant · High-performance Graph and Geospatial Applications · Founder @WeatherLayers · Neo4j @get_manta · Ex-@graph_aware · 👨👩👦👦
Jeroen Baas @JeroenBaas
353 Followers 363 Following Interrogate data until it spits out its darkest secrets. Work: Analytical and Data Services -Elsevier https://t.co/kVlMze70jr | @jeroenbaas.bsky.social
CAIDA @caidaorg
1K Followers 412 Following The Center for Applied Internet Data Analysis (CAIDA), a non-profit government-funded research unit doing network analysis and Internet visualizations.
Initial State @initialstate
1K Followers 192 Following Stream data from your devices and applications to beautiful visualizations in your web browser.
Atlas @atlas_logic_
3K Followers 0 Following Powering the next generation of companies and entrepreneurs.
Data Visualizations @datagraphics_
3 Followers 0 Following
Näytä Data @NaytaData
2K Followers 111 Following Maps, graphs and other data visualizations 🌍📊📈 Tweets in English and Finnish.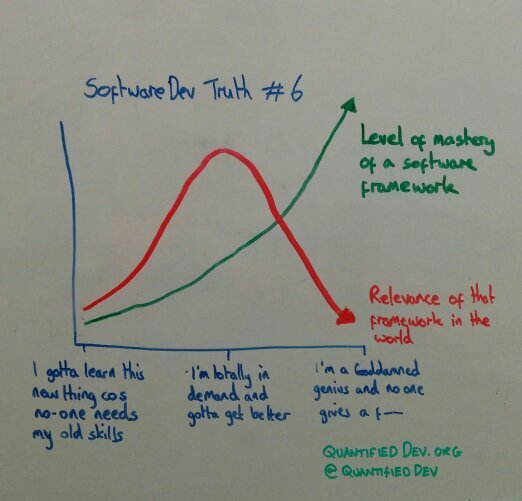
Dev Visualizations @DevDataViz
3 Followers 4 Following Humorous and informative data visualisations for software developers and programmers
NBC News Graphics @NBCNewsGraphics
10K Followers 891 Following Explaining the news through visualizations and data analysis from the @NBCNews Digital Data / Graphics team.
Tanveer Ali @tanveerali
2K Followers 1K Following Visualizations, maps and data at @USAFacts usually with a cup of coffee. @Suntimes, @DNAinfoCHI and @DetroitNews alum.
New Data Trends @newdatatrends
35 Followers 187 Following Follow for cool data stories from around the world, Insta/FB:@newdatatrends
Anita Lillie @anitalillie
932 Followers 522 Following Data, visualizations, people, health, self-tracking... a whole world of awesome!
Tom D @tdelet
761 Followers 1K Following Curious. Problem Solver. Dad. Fintech Product. Likes: Innovation, Design, Data visualization, Better financial markets, Crypto. (Arculus Wallet)
Katie Peek @kathrynpeek
1K Followers 561 Following Data visualizations for science magazines. Science journalist and Ph.D.-astronomer-at-large. Other skillz that this margin is too narrow to contain.
Bo Schwartz Madsen @BoSchwartz
2K Followers 2K Following Data scientist at the Danish Refugee Council @drc_ngo. Used to write about basketball. Tweets in English/Danish. He/him.Info Aesthetics @infosthetics
14K Followers 285 Following Data visualizations that inform and/or intrigue. Personal tweets at @vdmoere.
OpenSpace @OpenSpaceProj
1K Followers 325 Following Open-source astrovisualization software visualizing the known universe 🚀 Version 0.21.0 available for download

EVTechnologies, a div... @evtechnologies
611 Followers 304 Following We provide high-performance business intelligence (BI) systems, eye-catching data visualizations, and managed support services to data-driven organizations.
Robert Janezic @RobertJanezic
3K Followers 332 Following UX/UI Designer · Creator of https://t.co/GxqrvH1mlc
Linh Yao Pham @linhyaopham
705 Followers 202 Following Product Designer @hyperarc_inc. Previously @banyansecurity, @trifacta, @salesforce, @assistly.
Annie Shum @insightspedia
1K Followers 1K Following Data Scientist; Visualytics; Connect the Dots; Fractals; Data Visualizations & Analytics; Bigdata; Modeling Biological Aging & Healthspan Assurance
Kate Haley Goldman ht... @KateHG4
2K Followers 1K Following https://t.co/NLLCbGYx1T Principal of HG&Co. Enjoys rich data, elegant visualizations, and captivating narratives.
GoogleTrends @GoogleTrends
531K Followers 7 Following Official Google data and visualizations from the Trends Data Team. Sign up for our daily newsletter at the Google Trends site
Data Illustrator @dataillustrator
1K Followers 63 Following Create expressive infographics and data visualizations without programming.
markstats @markrstats
58K Followers 632 Following football data and tactics | https://t.co/7Loy8vGHKk | https://t.co/oJjOtdvWxS | @markstatsbot | donations https://t.co/C1xrr2D5I4
Ethiopia in Data 🇪... @ec0n1st
5K Followers 553 Following Dedicated to sharing Data & Visualizations concerning #Ethiopia 🇪🇹. T&RT may not be endorsments| Can be reached at [email protected] |Data is power! 📊
India in Pixels by As... @indiainpixels
242K Followers 658 Following Built https://t.co/fzeWKl1DqS (42000+ users) ✨ 600k+ subs on YT | https://t.co/fv5WDOz07K
Lech Mazur @LechMazur
32K Followers 442 Following CEO, Advameg, Inc. https://t.co/iLf8qsp4Qz founder Author: https://t.co/tnwqrUXTsY Author: 10 LLM benchmarks https://t.co/VcZLCofl1q
JFresh @JFreshHockey
135K Followers 124 Following Making hockey analytics make sense. Writer at @EPRinkside
Data Visualizations @DVisualizations
817 Followers 613 Following Data Visualizations is a website dedicated to providing our readers the best infographics on the web. Follow Us!Trends for United States
11,9 B posts
50,1 B posts
121 B posts
13 B posts
27,5 B posts
8.190 posts
10,6 B posts
20,8 B posts
10,4 B posts
4.934 posts
6.044 posts
9.770 posts
12,4 B posts
33 B posts
4.817 posts
2.249 posts
29,6 B posts
2.756 posts
2.568 posts
You might like

Gary Russo
@garyprusso
574 Followers