Search results for #DataVisualization

Top 5 Trends in #DigitalTransformation! #Infographic by @42gears cc: @CyrilCoste @WSWMUC @grattonboy @judsonalthoff @danielnewmanUV #appdevelopment #softwaredevelopment #datascientist #datavisualization #dataanalysis #machinelearning #digitalinnovation #digitalization


Unlocking Business Insights with SAP Leonardo #TargetedMarketing #IF "Targeted " #DataScience #DataVisualization #Marketing [Video] SAP Leonardo is a cutting-edge suite of intelligent technologies designed to revolutionize business operations. By… dlvr.it/T5lSd9

Visualizing Feature Importance in Models: We visualize feature importance in ensemble models to clearly illustrate what drives your predictions, providing deeper insights into the factors influencing your business outcomes. #FeatureImportance #DataVisualization

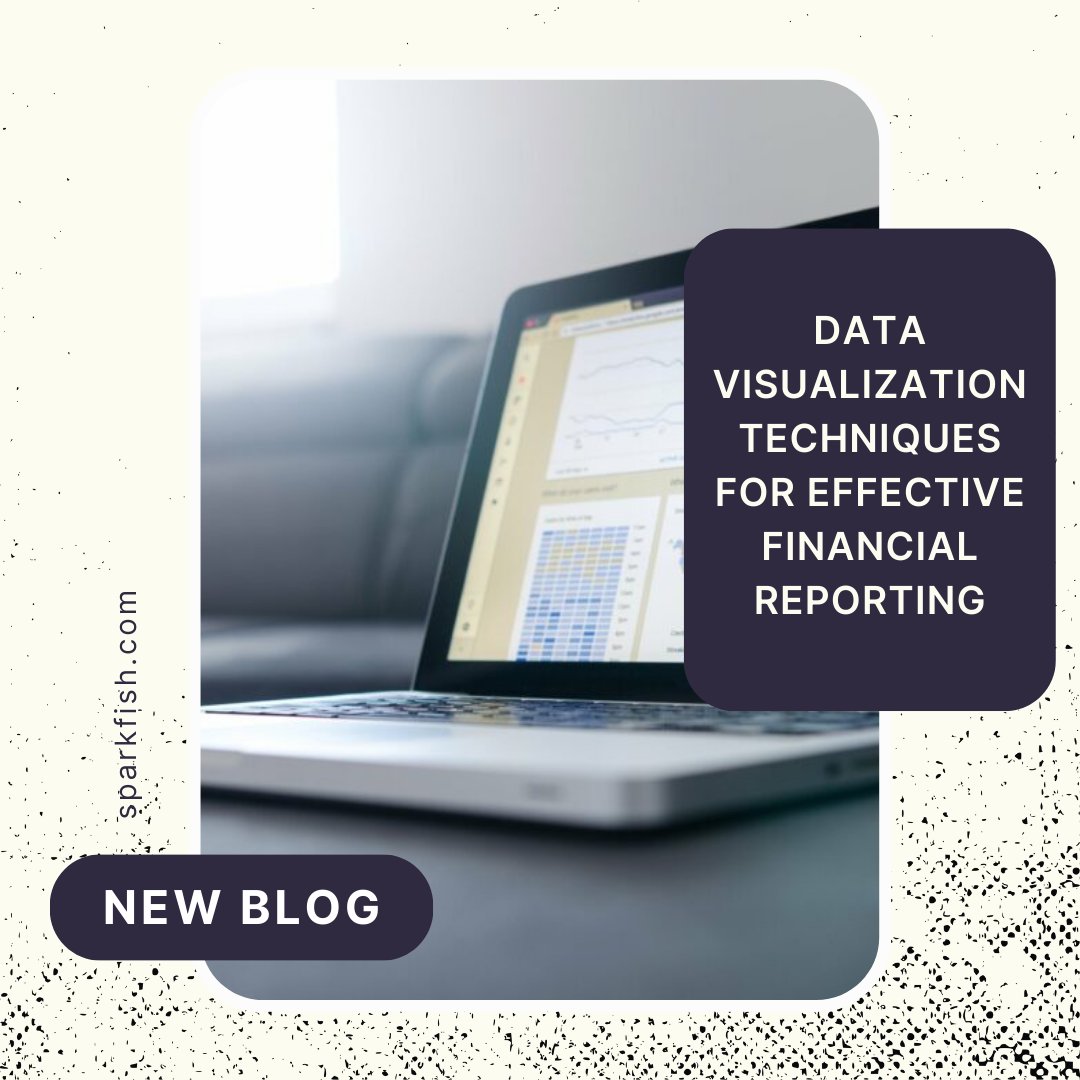
Financial reporting has gone beyond ledgers and spreadsheets. In this blog, we’ll discuss how data visualization is being used in financial planning and analysis (FP&A). Read the blog: bit.ly/43Cf8ZI #financialreporting #datavisualization #datavisualizationtechniques

Discover the power of #Wireshark 's IO Graphs! After you create a display filter, like 'ip.hdr_len > 20', see it instantly transform into a graph line. Learn more in this week’s Laura’s Lab Blog! ow.ly/iCxk50RiAb3 #DataVisualization #Cybersecurity #Troubleshooting

Explore the power of Advanced Analytics in STARLIMS! Unleash data visualization capabilities that go beyond Crystal Reports. 📊 #STARLIMS #DataVisualization hubs.la/Q02ttGyM0

#30DayChartChallenge | Day 18 | Asian Development Bank Growth of internet access in India: Trends in fixed broadband subscribers and internet users from 2000 to 2021. #ADB #Asia #India #DataVisualization #DataViz


I don't know why pie and doughnut charts have a not so good reputation. Why??? They have their good cases of use. I'm just starting this book and it's saying avoid them. #DataVisualization #DataAnalytics

Today is Day 2 since I started documenting I worked on: a. How to create a gauge chart and use it to make a better visualization in excel b. Using macros and custom number formatting to create a population chart #DataAnalytics #Datafam #MSExcel #DataVisualization #LearnInPublic

Is time for the first controversial #Formula1 🏎️ Sprint Race. A new simulation is available on the DataRoom. #DataVisualization and #AI powered predictions are proudly powered by us 😎 promezio.it/dataroom/f1

Explore Northeastern's College of Arts, Media and Design in Vancouver & its MS in Information Design and Data Visualization. Interested in the intersection of data, code and design? This graduate program is for you 👉 bit.ly/3vASCEf #datavisualization #MastersPrograms

Hey everyone😊 We are inviting writers to contribute to @WebDataRocks blog. Read the guidelines and reach out with a topic or a ready-made article! Let's build a stronger community around #webdevelopment, #dataanalysis and #Datavisualization topics⚡️ webdatarocks.com/write-for-us/

DataVisualization NL @DataVisNL
1K Followers 32 Following Updates on Data-Visualization-related events in the Netherlands. Suggestions for (re)tweets are welcome. (Coordinator: @YuriEngelhardt).
مهندس بيانا.. @Englisheazy
301K Followers 132 Following #DataEngineer #DataInfrastructure #DataDriven #DataWarehouse #DataVisualization #PowerBI #SQL #DAX #python #BusinessIntelligence #ChatGPT
The Data Science Bot @datasciencebot_
2K Followers 1 Following A bot created by @PatkarSumedh to retweet hashtags #DataScience & #DataVisualization Let's learn together! Misusing hashtags and spam will not be tolerated
Stefan Walther @waltherstefan
2K Followers 218 Following Passion for #AI #ML #CloudNative, #CloudComputing, #BigData, #IoT, #Analytics, #DataVisualization and #Leadership.
CryptoVizArt.₿ | Zi.. @CryptoVizArt
40K Followers 280 Following #Bitcoin | #DataVisualization 📊 | #ML 🤖 | Senior Researcher @glassnodeBenjamin Wiederkehr @datavis
13K Followers 549 Following Editor of Datavisualization.ch the premier news and knowledge resource for data visualization and infographics.
Visual Math @graphnow
2K Followers 0 Following #Math softwares for #calculus, #algebra, #geometry, #statistics, matrix, optimistics, data fitting, probability, #DataVisualization, fractal etc.
Maure Inmobiliaria @maureinmob
5K Followers 544 Following Inmobiliaria Buenos Aires Real Estate. Fuente de información para tus decisiones de inversión #datavisualization #datos #mercadoimobiliario
datavisualization @datavisual_d
46 Followers 59 Following Twitter account for http://t.co/oKnkxNsfrM
Laura Sutter @DotcomLaura
833 Followers 243 Following #Design #OnlineMarketing #AdobeAnalytics #DataAnalytics #DataVisualization #Tableau #datafam #daaorg #socialmediamarketing #tug ...follow @evolytics
Carlos Delgado Salas @CDelgadoSalas
1K Followers 354 Following UCAB - Georgetown University - Buscando valor a través de los datos. #DataWrangler #DataScience #DataVisualization #DataMapping
Intersectional Analys.. @ActivistData
765 Followers 167 Following Exploring race, gender, and social justice issues through #datavisualization, #infographics, and personal commentary. Contact: [email protected]
Pastel GBETOHO @pastelgpc
2K Followers 2K Following Data Architect #Dataintegration #Datamodelling #DataAnalytics #DataVisualization #Datagovernance #DataQuality
Mariusz Kanicki @MariuszKanicki
2K Followers 311 Following #corporategovernance #corpgov #DPSN2021 | GPW opinie prywatne | #datavisualization |
Medienneutral @medienneutral
1K Followers 847 Following Über medienneutrale Datenhaltung #Accessibility #Barrierefreiheit #a11y #DataVisualization #OpenAccess
Orange Data Mining @OrangeDataMiner
3K Followers 712 Following 🍊We make #DataMining Fruitful and Fun #Opensource software for #machinelearning #ai #textmining #datavisualization #datascience #bigdata Download FREE ⬇️
Thomas Preusse @tpreusse
945 Followers 307 Following Interested in #datavisualization, #journalism and #webdevelopment.
Algorithm Stories @algories
237 Followers 49 Following Creating stories using #ArtificialIntelligence #machinelearning and #datavisualization
Data Story @datstory
462 Followers 142 Following Creating stories using #datavisualization #dataviz #datstory
Paul Blickle @colorfuldata
4K Followers 1K Following Datavisualization and Infographics Editor, deparment Data and Visualization at @zeitonline
Julien Daubert @judaubert
2K Followers 614 Following CEO at @10h11 - keep building #datavisualization #datamarketing #datascience member of #G20YEA 2017 & 2020 🇪🇺 - $KAS Global Ambassador 🇫🇷🌏
ferdio @ferdiocom
1K Followers 535 Following Infographic agency transforming data and information into captivating visuals. #datavisualization #infographics

Andrés Muñoz-J. @SolarDynamo
286 Followers 107 Following Solar Physicist with a passion for #machineLearning, #dataVisualization, and #graphicdesign.
Ananda Sagar K @kommaluri
2K Followers 2K Following Social Scientist | Program Manager-Quality @Atos | ❤ #Analytics #BigData #CX #DataVisualization #DesignThinking #EnterpriseAI #IoT #MachineLearning #Robotics
Jian Adornado @JianArt
853 Followers 279 Following Product Design. Data Intelligence. Currently @Motive_inc. Previously @netflix, @dropbox, @uber, @amazon. #datavisualization #ai
@dataforacause @dataforacause
880 Followers 519 Following #DataForACause is an initiative that connects #datavisualization professionals with non-profits to help bring attention to social and environmental issues.
Datavized @datavized
2K Followers 1K Following Data-driven software tools and experiences #sonification #WebXR #3D #datavisualization #dataviz #geometric #twotone #morph
Pablo H. Paladino @palamago
3K Followers 2K Following Making data nicer all over the internet | @datawheel | #dataVisualization #frontend #openData #openGov #ddj | ❤ #NARDOZ
datavisualization ID @indonesiadata
11 Followers 8 Following Indonesia Data Visualization is a research & documentation center on Indonesian data visualization, based in Jakarta.
infographic.ly @infographicly_
1K Followers 888 Following Information design studio | Dubai & Toronto | Visual storytellers #infographics #datavisualization
Nele_Coghe @Nele_Coghe
1K Followers 971 Following #Analytics and #Datavisualization enthusiast. Product Marketing Manager @HexGeospatial
DataVisualization @DataVisualiza11
2 Followers 0 Following A data Viz aspirant currently working in the Tech field as an analyst. Very curious about the great work being done by peers and experts in this field.
Daniel Scott Vidovsky @danvidsky
523 Followers 1K Following #BEmusictech startup fandation® 👉 Indie musicians' #datavisualization essays - visual biographies - as a service 👌 Alumn BE incubs @StartitKBC @SirrisICT
Nalim Rafeeq @NalimR
2K Followers 2K Following Passion for #Maths #Physics #Research #DataAnalysis #DataVisualization #PatternRecognition #DataStories #Forecasting #Markets & #sports scores
Orlando Mezquita @orlandomezquita
628 Followers 768 Following Passionate about Analytics... I tweet about: #rstats, #datascience, #msexcel, #PowerBI, #datavisualization...
Ujjawal Singh 🇮�.. @ujjawalsingh
2K Followers 1K Following Creator of successful web and mobile products. TedX speaker/ Angel Investor #bigdata #mobile #datavisualization #tech #politics #india #KREC #NITK #IIML
atlo.team @AtloTeam
1K Followers 873 Following Visual and data journalism team of Budapest-based investigative center @Atlatszo #dataviz #datavisualization #graphics #ddj #maps #datajournalism
Data Visualizatio DP @datavisualiz_dp
1K Followers 2K Following datavisualization, Design, 3D, Map, Processing, Book, Information Is Beautiful,
Christina Thiele @cs_thiele
1K Followers 2K Following Comms & marketing pro tweeting on #science + #datavisualization + #livablecities + #livablespaces + #sustainablebuilding + #healthyworkplaces + #whateverworks
Stela Yordanova @stela_yordanova
867 Followers 871 Following I find data out of sights, one beautiful, bar chart at a time! (she/her) #datavisualization
Yvonne @YvonFitz
720 Followers 614 Following | traveling scientist, photographer | ❤️ Making Data Actionable | 📉 #DataVis, #DataVisualization, #DataScience, #Data 📈 | Curating Data Viz Society Instagram
Syvylyze Analytics @syvylyze
1K Followers 2K Following Business Insights using Visual Analytics #DataVisualization #DataViz #Analytics using @tableau
Dimitris Karagiannis @DKaragiannis
788 Followers 2K Following Data Engineer focused on BI #Informatica #SAP Tweets about #BI #DataIntegration #DataGovernance #BigData #Analytics #MDM #Dashboards #DataVisualization #CloudBI
Kieran Morris @kieranmorris196
555 Followers 692 Following Tableau Data Visualization Analyst. Manipulating #BigData producing #DataVisualization graphs with Tableau.
Jolicharts @Jolicharts
1K Followers 2K Following #DataAnalytics for your Web Application #DataVisualization, Excel charting and presentations. #SaaS, #dataviz, Simplied #Bigdata for community
Manuel George @manuelgeorge
1K Followers 1K Following Visual Editor of #MalayalaManorama @manoramaonline (Newspaper with 2.35 million daily circulation). #Infographics, #DataVisualization, #VisualStoryTelling.
DesideDatum Data Comp.. @desideDatum
1K Followers 1K Following DesideDatum is a Data Company focused on #DataGovernance, #OpenData, #DataAnalytics, #Transparency, #oGov #Accountability and #DataVisualization
Timotheos Frey @timfrit
626 Followers 2K Following Citizen •• communication specialist •• political scientist •• loves and creates #datavisualization •• Threema ID: 89R8JWYN
Justin Garrity @justinogarrity
2K Followers 2K Following VP of Product @ChartHop #datastoryteller #datavisualization #peopleanalytics #hr #hrsoftware
Qlik Partner Network @QlikPartners
703 Followers 1K Following @Qlik partners drive business transformation using Qlik’s leading-edge technologies for #DataAnalytics, #DataVisualization, and #DataIntegration.
Aránzazu Cruz @arancruzmar
946 Followers 683 Following Computer Engineer and Journalist. Technology projects and products. I like data, #ddj and #datavisualization. Not without coffee. Amateur musician.
Yusnelkis @Milanes_guisado
1K Followers 2K Following Research Data Analyst. #Datavisualization #datamanagement #DataSteward #bibliometrics #DatosFAIR #DMPs #datalibrarian #healthcare #systematicreview #consultant
Paul Hodge @DataVizGuy
906 Followers 1K Following Passionate #DataVisualization evangelist, and part-time Global Nomad. Exploring the intersection between #BigData, #Design and #Storytelling (#DataViz)
Tennis Visuals @TennisVisuals
458 Followers 495 Following Tennis Parent, Ecological History, cisgender, #dataviz, #datavis, #DataVisualization, #analytics, #dataanalytics, #d3js #nodejs
Helen Cooper @HelenOfStow
386 Followers 1K Following Passionate about making a difference using #DataVisualization #Geospatial & #GIS. Founder of Map It Out. she/her
DataVisualization @RealDataVisual
4 Followers 0 Following
Manish Desai @manishdesai1
881 Followers 2K Following Director @SAS India with focus on #DataScience, #MachineLearning, #InternetofThings, #BigData, #Analytics, #DataVisualization, #DataManagement, #IoT, #Data, #BI
Digital Intervention @paulkaiser
1K Followers 2K Following Inspired by everything around me | Social Media Strategist by day, Futurist by night. #DataAnalyst #DataVisualization #Tech #Influencer #Photographer #Historian
Miguel Blázquez @Mblazquez10
705 Followers 1K Following #Marketing / #marketingdeportivo / #bigdata / #bigdatasports / #Publicidad / #datavisualization / #infographic
Oliver Staubli @oliverstaubli
384 Followers 1K Following Founder of @Revolytics AG. #DataScientist providing #AdvancedAnalytics services to clients with #BigData challenges. Loves #DataVisualization & #MachineLearning
Widianto Nugroho @WIDIANTONVGROHO
489 Followers 456 Following Suka menggambar IG https://t.co/NqMBDv270T Past: #creativecoding #processing #datavisualization #infographics
art|code @Thematizer
866 Followers 2K Following #datavisualization made beautiful. Free #SRI and #greeninvesting newsletter at https://t.co/37h247VVIB
DataVisualization @DataVisualizat3
2 Followers 0 Following
Eugene Tjoa @eugenetjoa
423 Followers 359 Following Designing and creating interactive applications |Datavisualization | Eindhoven
Giovanni Profeta @profeta_g
381 Followers 770 Following Interested in #datavisualization #interactiondesign #mapdesign
ThomasLe_DataVisualiz.. @LeDa73901
1 Followers 3 Following
LEOLO~DataVisualizati.. @LEOLODataVisua1
0 Followers 0 Following This account is used to display my data viz.