
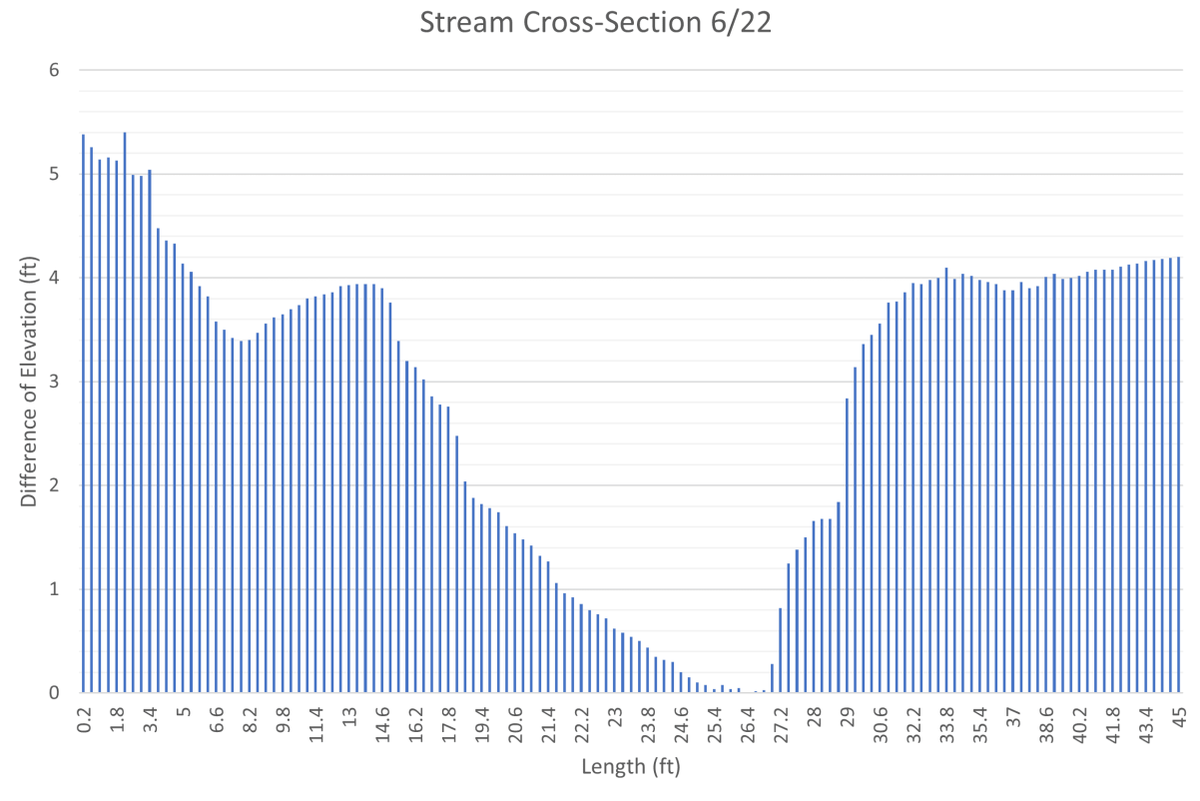
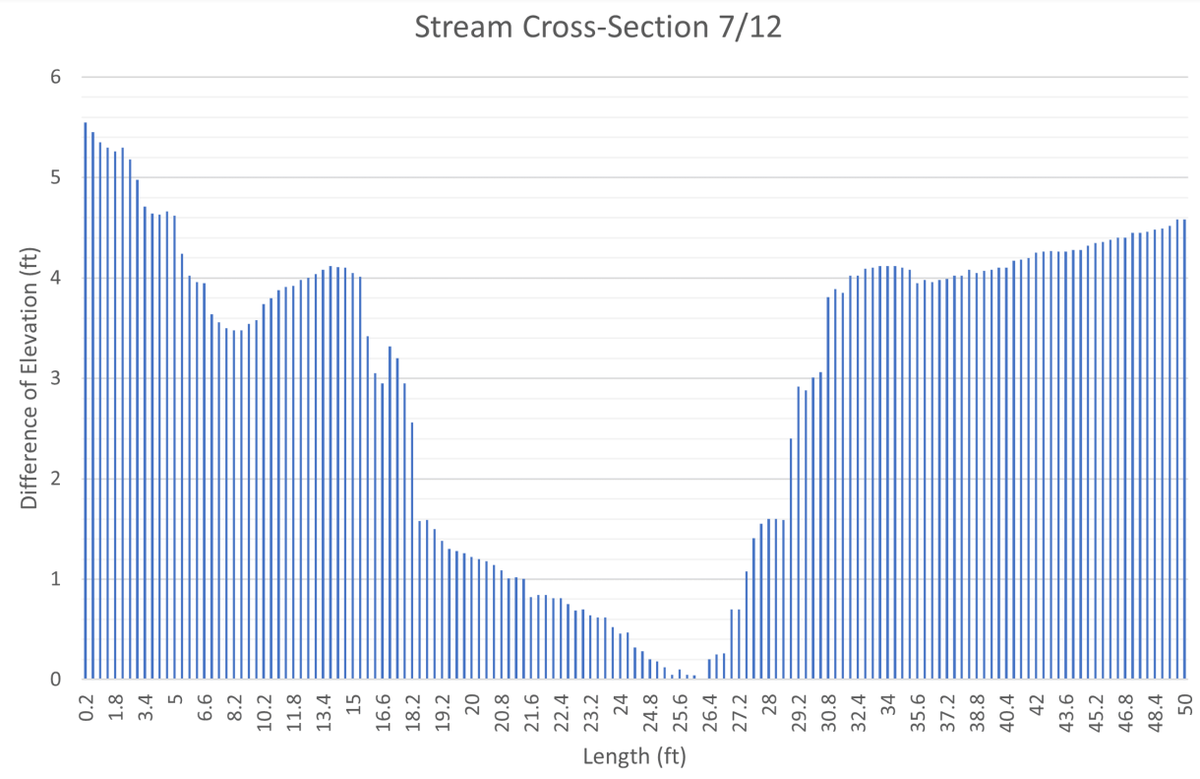
We went out to the field site and collected cross-sectional data with the Auto-Level and Philadelphia Rod again! The two graphs below show the cross-section of the stream before and after the major flooding event that occurred on July 1st.

0
0
0
0
0
Download Image