
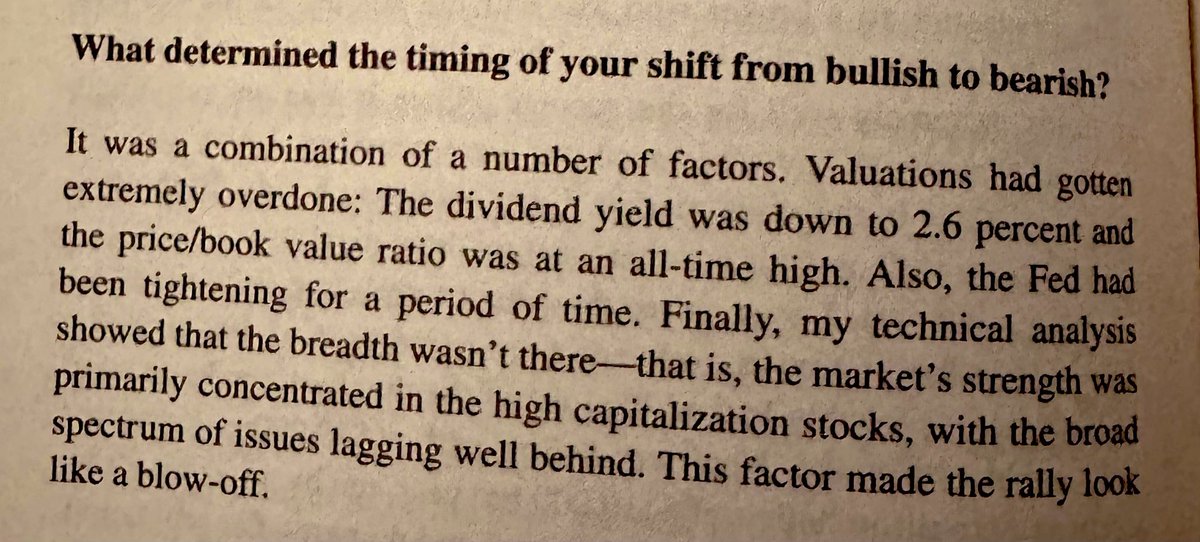
Drunkenmiller on the 1987 stock market crash

@MFHoz Original post x.com/donmiami3/stat…
@MFHoz Original post x.com/donmiami3/stat…


@MFHoz Reminds of the fantastic documentary about Paul Tudor Jones in 1986 and 1987. If you haven't watched it, you should, it's brilliant. (if you can find it online) x.com/TomasOnMarkets…
@MFHoz Reminds of the fantastic documentary about Paul Tudor Jones in 1986 and 1987. If you haven't watched it, you should, it's brilliant. (if you can find it online) x.com/TomasOnMarkets…


Let's break it down: 1. “Overdone valuations”: When stock prices rise beyond what their fundamentals justify, they become overvalued. This can make them susceptible to corrections or downturns as investors reassess their positions. 2. “Low dividend yield”: Dividend yield is the ratio of a company's annual dividend compared to its share price. A low dividend yield, like the 2.6 percent mentioned, could indicate that stocks are overpriced relative to the income they provide investors. 3. “High price/book value ratio”: This ratio compares a company's market value (its stock price) to its book value (its net asset value per share). A high ratio suggests that investors are willing to pay a premium for a company's assets, which can indicate overvaluation. 4. “Tightening by the Fed”: When the Federal Reserve tightens monetary policy by raising interest rates or reducing monetary stimulus, it can slow down economic growth and dampen investor sentiment, potentially leading to market declines. 5. “Poor market breadth”: Market breadth refers to the number of stocks participating in a market move. When breadth is weak, meaning only a small number of stocks are driving gains while the majority are not, it can signal that the market's strength is not broad-based and may not be sustainable. These factors together suggest a potential bearish outlook for the market, as they indicate possible weaknesses in valuations, investor sentiment, and economic conditions.

@MFHoz You are purposely being led astray. They did not have a seismically erupting industrial revolution awaiting roll out in 1988.... This time is very very very different. Beware factoring in the future off the old datum.

@MFHoz Druckenmiller was wrong big time on 2023, so I don't know


This will happen at some point, but the chart will show it, and RSP (equal weight SPY) is not breaking down. Further, IWM could, maybe, be breaking out to the upside. Anyway, I try to be in cash at the EOD everyday so it doesn't matter to me, but I'm not investing towards this until it starts to happen. Why? Because I tried that for a long, long, long time and lost an ENORMOUS amount of money. This is just my two cents. Thanks for the post.

@MFHoz Unpopular opinion: the 1987 crash was kinda stupid and unwarranted. Also markets have gotten more efficient since then. Ergo we will not see a crash like 1987 happen again under similar circumstances


@MFHoz Eerie to say the least. I’m normally a perma bull, but I find this excerpt fascinating. From my findings price/book near record highs, dividend yield obviously lower than 2.6, and I’m hearing of the lack of breadth In The market repeatedly. Less broad than mag 7 even.

@MFHoz it was the combination of dollor and bonds.


@MFHoz Wasn't there also a technical analysis that he reviewed with Paul Tudor Jones that was the tipping point? Also which book is this?

@MFHoz NVIDIA 0.023% Annual dividend yield

@MFHoz This is analogous to our current situation

@MFHoz What's new in stock markets crashes that has happened except selected few have timed it perfect.

@MFHoz Does that mean it gonna crash Thursday? asking for a friend.

@MFHoz hmmmm🧐 Sounds eerily familiar


@MFHoz March 11th, 2024. Black Monday. Why? The market always seems to tank in mid-March. sim sala bim


@MFHoz FOMO is so strong, nothing else matters. Even if NVDA has bad news tomorrow, the Fed will always have the trump card to play, although cutting rates now would be a huge gamble.

@MFHoz is it from " market wizards" by Jack Schwager?

