
Explained @__explained
We turn complex data into charts, maps, visuals and data stories. Contact us if you want to use our visuals or collaborate with us: [email protected] explainedstudio.com Stockholm, Sweden Joined December 2022-
Tweets93
-
Followers276
-
Following7
-
Likes4
The EU elections are around the corner. According to @EU_Eurostat almost 360 million EU citizens are eligible to vote this year #EUelections2024 #ddj #dataviz

In today's Stockholm Marathon, 23 000 runners participated. Here are this year's winners and the best times since the first marathon in 1979 #stockholmmarathon #datavisualization

The EU election is approaching! European citizens prioritise fighting poverty and social exclusion, and public health. Priorities vary significantly across individual countries Read more: explained.media/key-issues-ahe… #Europe #elections #ddj #datavisualization

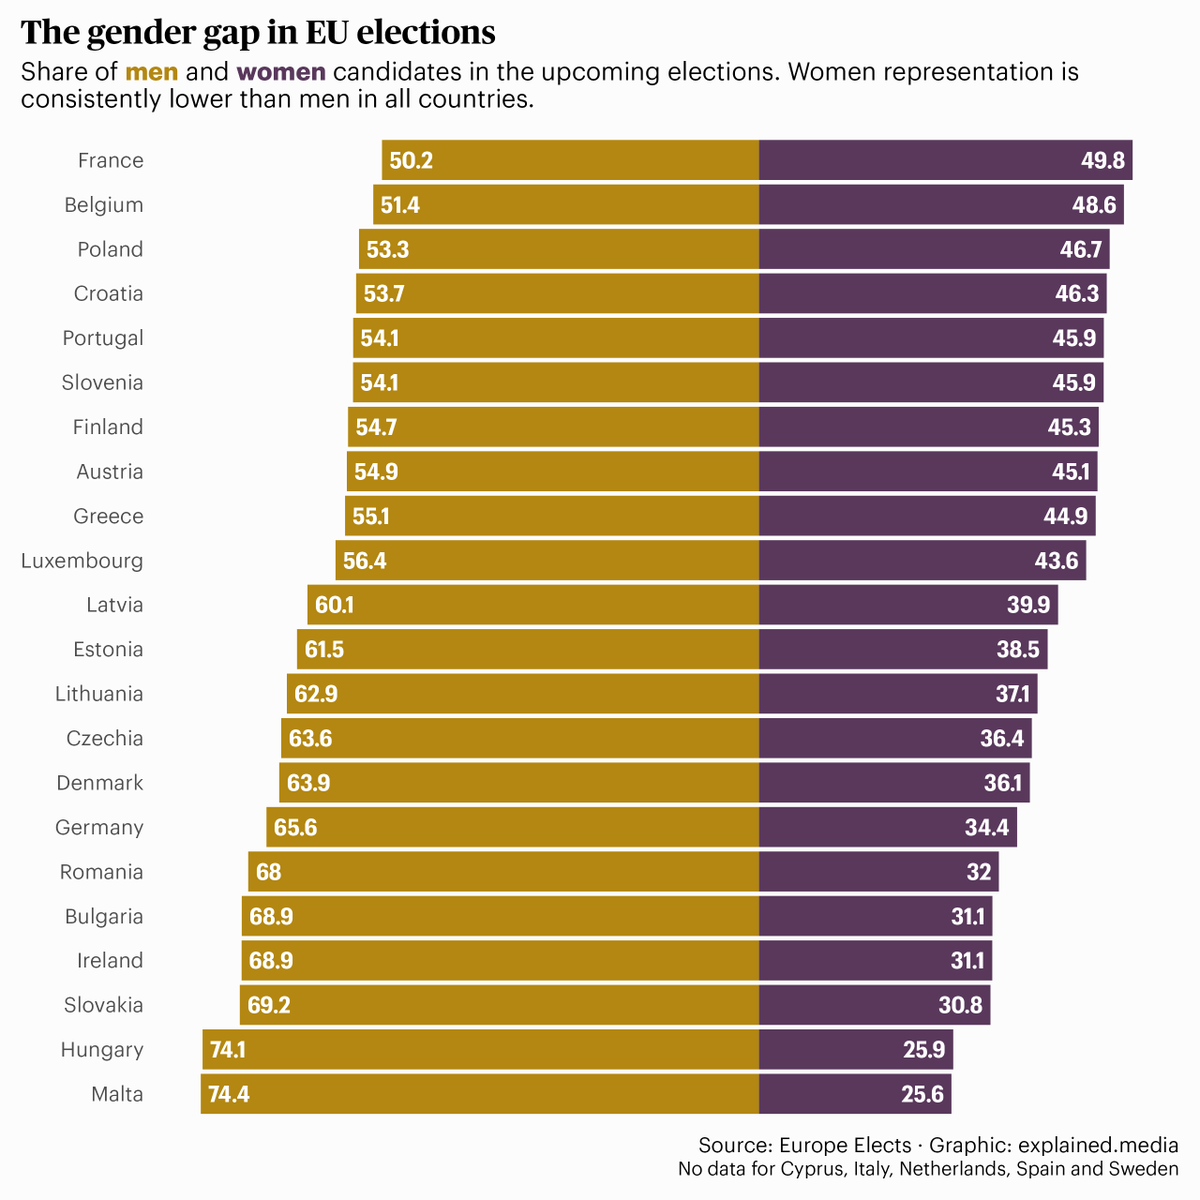
Women candidates are underrepresented in all countries in the upcoming EU elections Source: @EuropeElects #dataviz #datajournalism #elections #EU
50% of the Indian population is under 28, yet the current Lok Sabha lacks representation of the younger population and shows a significant gender gap Sources: @IPUparliament and @ppyramidnet #ddj #elections #dataviz

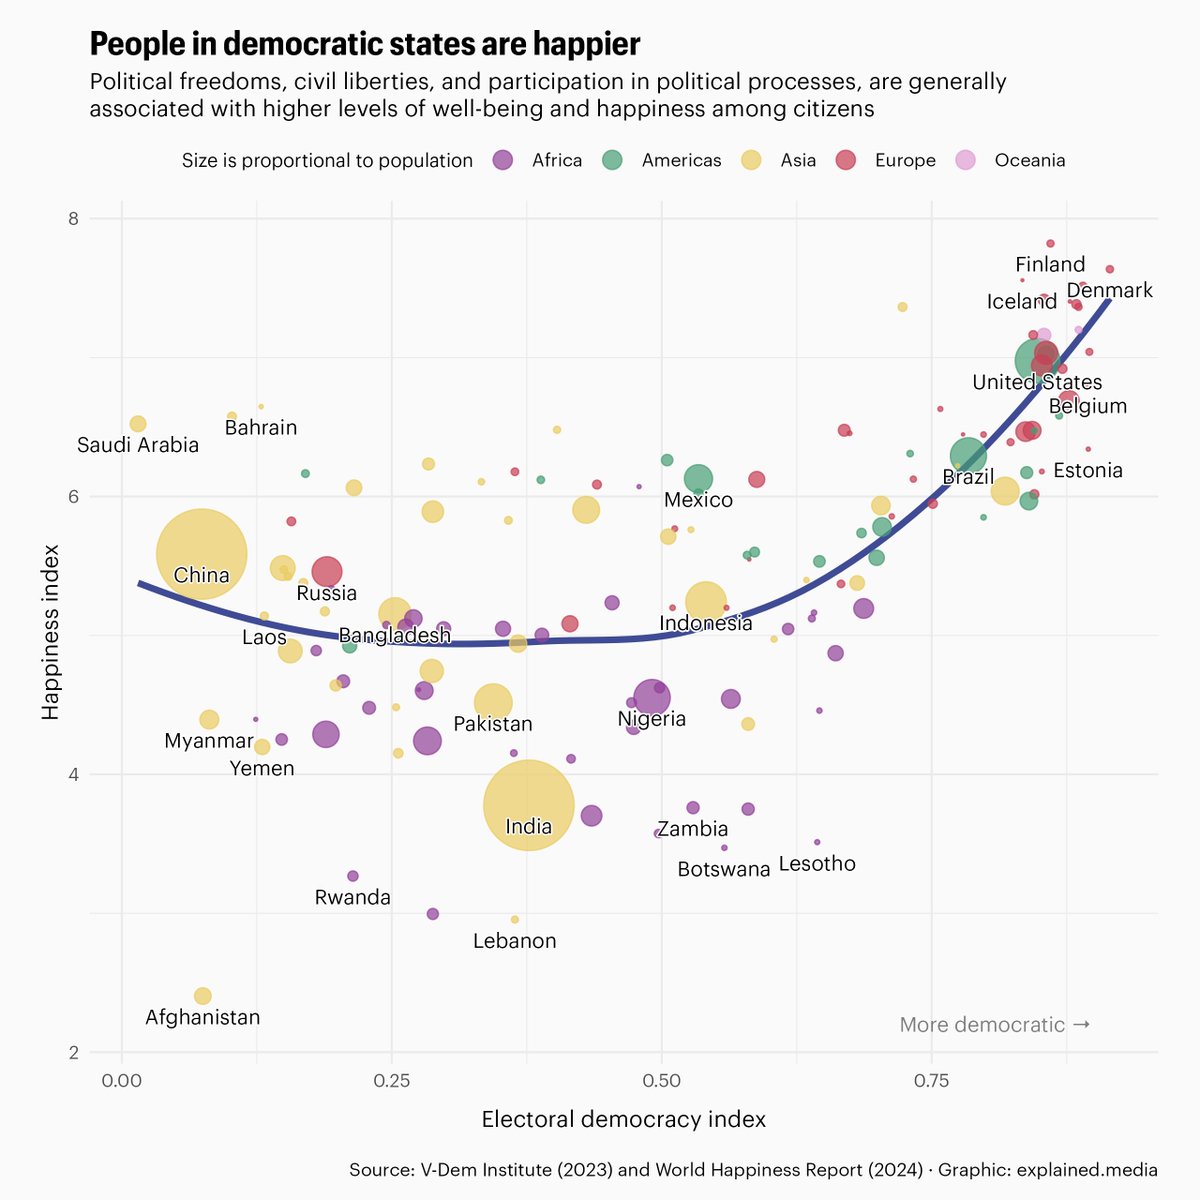
People in democratic states are happier The positive correlation between high #democracy scores and #happiness becomes clear when combining the latest data by @HappinessRpt and @vdeminstitute Explore an interactive version at datawrapper.de/_/u7gL3/?v=6 #ddj #dataviz #WHR2024
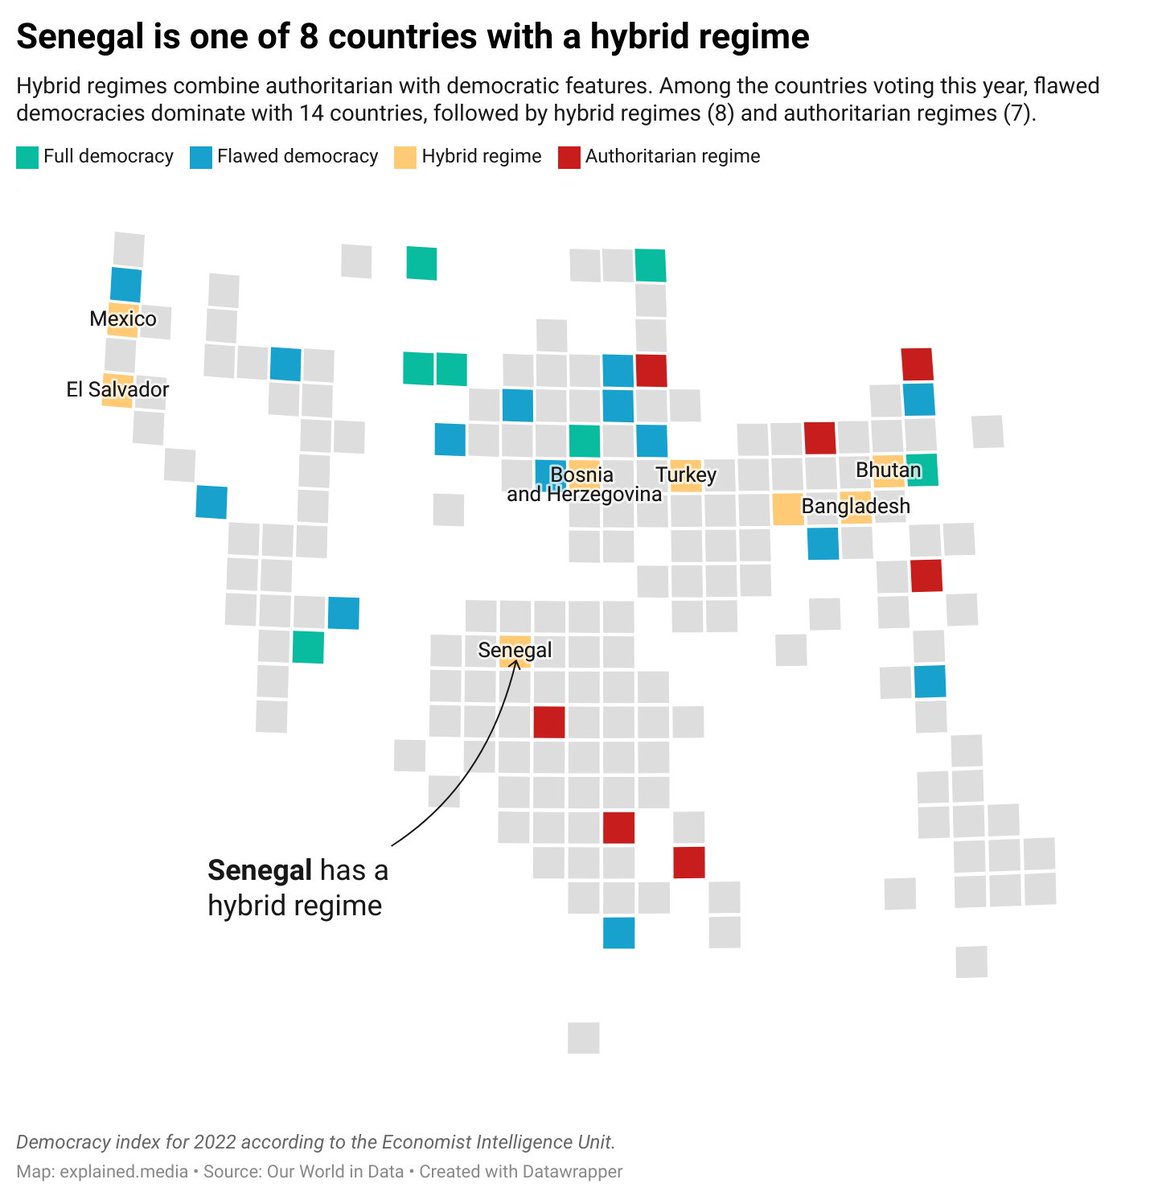
People in Senegal are voting for a new president today. 1. Among the countries voting this year, Senegal is one of 8 countries with a hybrid regime acc. to @TheEIU. #datawrapper #elections #dataviz #datajournalism #senegaldecides #senegal
On January 28, Finland elects its first new head of state in 12 years. Here are the top 3 candidates in the opinion polls leading up to the election


sbl46eo0 @sbl46eo085283
47 Followers 679 Followingjoita andrei @andrei_joita
164 Followers 7K Following
Rini @rinimukkath
229 Followers 439 Following Head of Comms @mdi_uk. Views expressed here are my own.
erdeneremineker @erdeneremineker
193 Followers 1K Following Teaching&Research Assistant TEDU Economics PhD Candidate METU Economics
KostasBouk @Kostas_Bouk
914 Followers 4K Following
Tim Mellman @tim_mellman
192 Followers 417 Following CYJ Midwest ‘15-‘18, ‘22-‘23 /// OPRF ‘22 / WashU ‘26 // CHI, STL, DC // Proud Jew and Raging Zionist
Liam Wright @LiamJWright13
157 Followers 867 Following Data Analyst, @ActuallyNull we got beats like it's the lizz nizz on earth, yo
Radrodro @Manasseh_6
1K Followers 2K Following | Cool Dad😎 | 🇰🇪 Rugby Athlete @kcbrugby | Data Analytics Consultant | Passionate about Sports Data Analytics | 29.09.2029
Not Your Average Spur... @schmid_07
127 Followers 316 Following I post Spurs content and more. also, go check out my YouTube channel https://t.co/LKrtZHX6jm
Dora Nemeth @dora_nemeth_
111 Followers 307 Following information designer, illustrator, creaturemaker, visual journalist at @RFERL
Okhaifo (✍🏻,📊... @okhaifo3
591 Followers 2K Following learning, implementing, relearning ... ✍🏻( Data, Fintech , SEO, Personal Finance)
gustheil @gustheil
7 Followers 88 Following Inventor do Índice de Theil, Regra de Taylor, TMTheil e polinômio de Theil
Lorenzo Amabili @LorenzoAmabiliX
1 Followers 29 Following
Abigaïl Rabinovitch @abigail2154
197 Followers 1K Following
Baruch @datavizero
21K Followers 6K Following Geographer turned data storyteller 📊 Maps, crime, cities & elections 🌆✨ Visuals in @OnceNoticiasTV | GIS + Python nerd 🛰️
JCCD @westlakevp1
268 Followers 4K Following
Silvio Heinze @silvioheinze
1K Followers 3K Following Founder & Chair https://t.co/aK0uQamgFq. Data scientist and information designer. Makes code and things. @[email protected] #airquality #dataviz #citizenscience

Lea @irgendeine_lea
40 Followers 201 Following economic geography || geoeconomics, inequality & feminist economics || currently learning #rstats & dataviz 🌈📊 - find me on Bluesky - no new posts here
Aman Bhargava 📊 @thedivtagguy
2K Followers 2K Following data, design, maps, urbanism Dev @RevisualLabs, prev. @ReutersGraphics | #DataViz 🦋 https://t.co/vGOuHOJqRW 📧 [email protected]
Üzüm Lab @langtory34
131 Followers 3K Following language lab #language #art #tech Paris\İstanbul [email protected]
Dr Mohammad A. N. Ale... @Lingoleader
831 Followers 784 Following Quantitative corpus linguist @DELLATKU Kuwait University 🇰🇼 | @ucdslcl alumnus 🇮🇪 | عضو هيئة تدريس في كلية الآداب - جامعة الكويت
Juanjo Garcés @juanjogrcs
253 Followers 595 Following Blessed is the man who can laugh at himself, for he will never cease to be amused. Thomas More #postdoc in #mmsm at @sloan_kettering
Rhi Storer @rhistorerwrites
3K Followers 3K Following Reporter | Once @birmingham_live @guardian @schoolsweek | @JSchofieldTrust fellow 23 | Sporadic tweets frequent DMs
Zaw Myo Tun 梁维斌 @zawmtun
378 Followers 661 Following MBBS, PhD | Here to learn/share epi and stats | retweet ≠ endorse
Glen K Campbell 🇪�... @GlenKCampbell
5K Followers 7K Following #Comms @EUPublications @EU_Commission, sharing facts not #disinfo. My views! Also on: https://t.co/uS9OVaVTHm; https://t.co/H4KAbXPepk
246Capital @246Capital
18 Followers 120 Following 24/6 Capital is a boutique consulting firm, with the passion and mission to facilitate trade. A different generation of Corporate+ Government consultants 💜
Dorothee Beckendorff @DoroBeckendorff
372 Followers 670 Following PhD Student Urban Demography Lab @EPFL_en | Working on migration in cities of the Global South | EDSD 21/22
Adrian Lundberg @lundberg_adrian
241 Followers 288 Following Multilingual and Transnational Academic Developer & Educational Linguist with a PhD
david @cioranman
116 Followers 2K Following
IngFrustrado @IngFrustrado
478 Followers 3K Following
Mikel Akel @mikelakel
5K Followers 5K Following Practicante de ciencias neoliberales Quiero morir en Marte
Jasmin Nihalani @nihalani_jasmin
1K Followers 989 Following Senior Data Journalist for BBC News (Indian languages division) Previously with @the_hindu Alumni @acjindia
Kshitiz Khanal @kshitizkhanal7
2K Followers 5K Following Research Associate at ITRE (NC State). PhD from @UNC @DCRPCarolina. Works on AI/ML for transportation and energy planning. Board member @okfn_np.

aconitum @napellus
63 Followers 7K Following
JPM @JPM__09
166 Followers 362 Following A simple man, living in a simple world, complicated by simple people.
Silambarasan @reachsimbu
1K Followers 4K Following Data Wrangler::transforming rows and columns into insightful Predictions💹📈📉
Themis Efthimiou @ThemisEfth
209 Followers 630 Following Quantitative Researcher | Psychology PhD | R & Python
Cameron Yick @hydrosquall
2K Followers 4K Following data vis & diagrams. co-organize @DatavizNYC + building @datadoghq. visual exaptation | creative (en)coding . https://t.co/1A4fMmtfUJ
H. @hferrerr
100 Followers 174 Following


George Bariamis @George_Bariamis
191 Followers 1K Following MEng Civil Engineer, Hydrologist and Water Resources Consultant-Analyst, @ntua #Hydrology #IWRM #Floods #Droughts born at 348 ppm
Dr. Pete Wegier @petewegier
264 Followers 426 Following Senior Director, Research Institute & Research Chair @HRHospital | Assistant Prof @ihpmeuoft @UofTFamilyMed | ❤️ #dataviz | tweets my own | RT = RT
Ned Letcher @nletcher
1K Followers 8K Following data (science | analytics | visualisation | engineering), @thoughtworks, #Python, #nlproc, ML, & assorted whimsical miscellania
Marieke Kuypers @KuypersMarieke
20K Followers 14K Following Journalist | Factchecker | Management: [email protected] |🇳🇱
Mabukizwe @AubreyMabona
420 Followers 1K Following data science, social science, politics, human geography.
M.Yuvan @Yuvan_aves
3K Followers 766 Following Naturalist | Writer | Nature-Educator Instagram - https://t.co/fOAaPCsKPH Latest book - Intertidal : A Coast and Marsh Diary
Francesco Scomazzon @FrancescoScoma2
46 Followers 174 Following @mybcu - Data Journalism 🧑🏻💻📈🇬🇧 @unipr - Giornalismo e cultura editoriale 📚🖋 @UniPadova - Lettere Moderne 🎓
Inbal Rief @balcooly
357 Followers 982 Following ✧ Data empathy designer ✧ Partnerships director @VizFSG ✧ Mentor & workshops ✧ 1/2 of @amiduet ✧ https://t.co/EdtUrb8Ts0
Anne-Marie Dufour @DufourAm
91 Followers 64 Following 🤓 Data Visualizations Developer 📘 Co-author of D3.js in Action (3rd edition)
ami duet @AmiDuet
42 Followers 56 Following We're Anne-Marie Dufour @DufourAm and Inbal Rief @balcooly, the AMI-duet! Together we design and develop data visualizations.
Karthik Muthuswamy @karthik_muth
191 Followers 396 Following Co-founder & Data journalist at Explained: @__explained https://t.co/XtQ0pVASkG Husband & dad. Like people, mountains, sea, outdoors, sports and nature.
Trends for United States
You might like