Search results for #DecodingCharts

Have discussed at length on CNX IT . #ChartDecoder #DecodingCharts
Have discussed at length on CNX IT . #ChartDecoder #DecodingCharts
Today's view Nifty OI interpretation Oi decreasing with rise in price. Short covering OI needs to improve for a sustained rally. #ChartDecoder #DecodingCharts


Today's view Bank Nifty Daily: The index has cleared 54900 zone. The next zone to watch out for will be 55600 to 55700 where both 100 and 200 SMA lies. #ChartDecoder #DecodingCharts

Today's view Nifty Daily A breakout above 25100-25200 has taken place. Till it holds above this zone, one may consider the trend to be up. RSI has moved past 60 levels ADX still to participate (flat at 17-18) PDI clearly dominating. #ChartDecoder #DecodingCharts

Be a technical observer, not an analyst. As an analyst you tend to give a view which may or may not be vindicated by the market. As an observer you just watch the continuous unfolding of charts. #Chartdecoder #DecodingCharts
Bank Nifty: Near a major resistance zone (54900) ADX moving lower, RSI at equilibrium zone. Hourly Bollinger has squeezed. ADX moving up gradually but inclination is not sharp. RSI just below overbought zone. #ChertDecoder #DecodingCharts


Today's view Bank Nifty OI interpretation: Significant fall in OI in recent days. (25% lower from peak) OI not increasing in the recent rally is sign of worry. #ChartDecoder #DecodingCharts


📘 Decoding Charts: A Handbook of Technical Analysis Get your copy 👇 chartdecoder.com/e-book #ChartDecoder #DecodingCharts
If the expected gap up opening sustains, it paves the way for new all time high. Any close below Yesterday's close will be read as markets ignoring good news. Let's hope for the best. #ChartDecoder #DecodingCharts
Today's view Bank Nifty: Slight shedding of OI, Overall OI high in the system(see chart). Possibility of sudden short covering. #ChartDecoder #DecodingCharts #Markets


Today's view Bank Nifty: Major resistance now lies at 54900 to 55000. ADX in daily charts making an U-turn RSI has just entered oversold zone #ChartDecoder #Decodingcharts #BankNifty

Hourly charts ADX nearing 50: Signs of oversold zone in short run RSI : Exhibiting positive divergence. Conclusion: May have a short term rally but till 100 SMA is taken out, confidence of bulls will not be restored. #ChartDecoder #Decodingcharts #Nifty

Today's view Nifty Daily: The index is presently below both 200 and 100 SMA. It needs to rebound above these levels for any meaningful trend reversal to come ADX making an U-turn: Not a good sign for bulls #ChartDecoder #Decodingcharts #Nifty
⏳ Time is running out! E-book buyers of Decoding Charts before 31st Aug get a FREE 3-month bonus: Supertrend + RSI system + weekly Global Chart Classroom. #ChartDecoder #DecodingCharts


On hourly charts ADX has reached 49 and RSI hovering inside the oversold zone. Prepare for volatility #ChartDecoder #DecodingCharts

On daily charts the index has reached a zone where previous swing major swing highs came up. RSI has reached oversold zone (no way signs of bottom) ADX making a U-turn, a signal which one should not neglect. #ChartDecoder #DecodingCharts No signs of reversal as of now.

Today's view Bank Nifty: OI change significant but needs to be taken with a pinch of salt for expiry consideration. #ChartDecoder #DecodingCharts


On hourly charts though RSI has reached oversold zone, ADX is indicating a trending market. #ChartDecoder #DecodingCharts

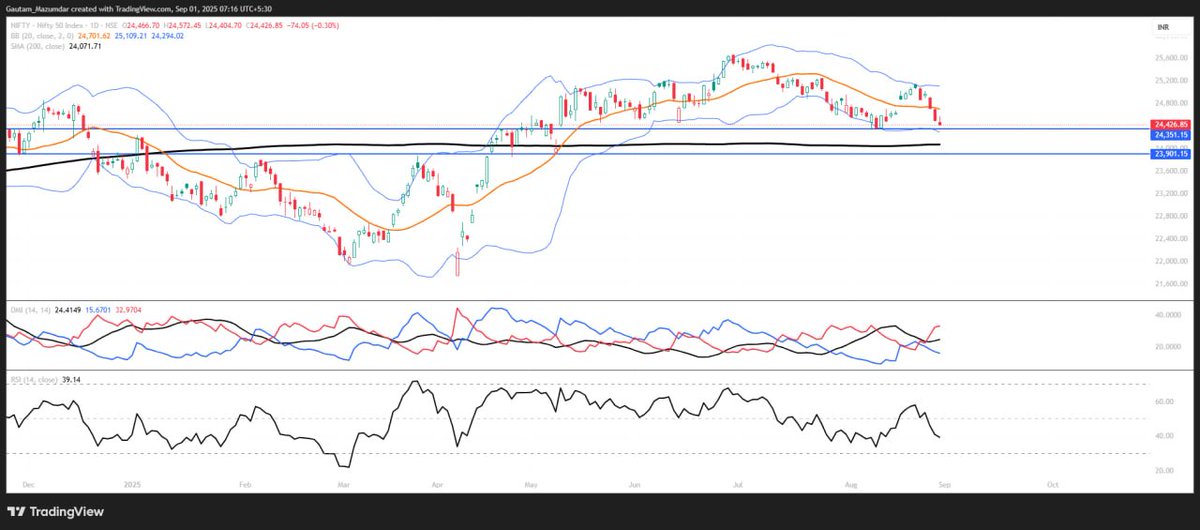
On daily charts Nifty is breaking one support after another. Presently the 100 SMA ( 24675) needs to be watched out for for any signs of reversal. Lower side supports are at 24340 and 24070 (200 SMA). #ChartDecoder #DecodingCharts

Today's view Nifty: The open interest change will not provide much clue till Friday's data is available as major changes can be observed due to expiry and rollover. Apparently it looks shorts were further added. #ChartDecoder #DecodingCharts


