Search results for #GraphVisualization

G.V() 3.38.90 is out, bringing official support for FalkorDB, quality of life improvements and a better graph style customization user experience. For a detailed breakdown of the features, check out our announcement at gdotv.com/blog/gdotv-rel… #graphvisualization #falkordb

👉 See our latest blog post about turning complex graph data into clear visual insights. Learn best practices, tool selection, and layout methods for visualizing connected data at any scale. #GraphLayout #GraphVisualization #DataStructures #graphdatab... bit.ly/3HYXU2p
On Labor Day, remember: every worker is a vital node in the network. Strong connections build strong communities. bit.ly/3HT4x6j #laborday #solidarity #graphtheory #graphvisualization #graphtechnology

Our latest blog post is about large-scale graph visualization. Explore how to visualize massive graphs at scale—reduce complexity, boost interactivity, and reveal insights in cybersecurity, finance, and more! 🌎📈 #graphvisualization #tomsawyersoftwar... hubs.li/Q03zQmmV0
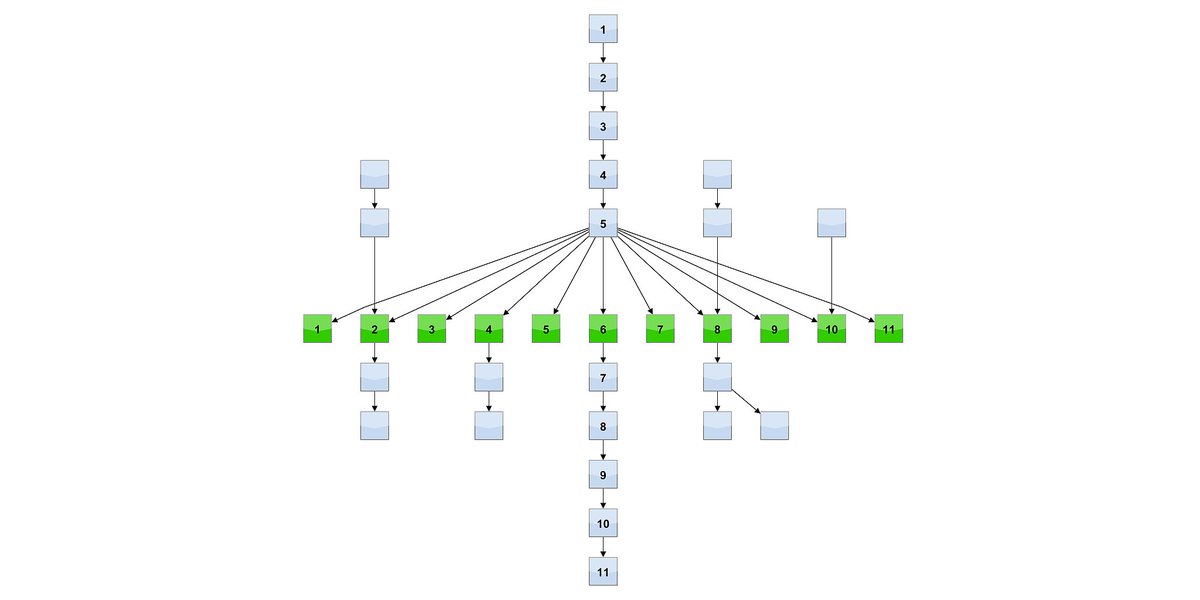
In Tom Sawyer Perspectives, hierarchical layout keeps nodes in order vertically. Use the Sequence layout constraint to maintain horizontal order. Learn more about Sequence and other constraints at bit.ly/44Tr3mX #graphvisualization #graphtechnology
Introducing Perspectives 13.3: New Kuzu database integration with Guest Speaker Semih Salihoğlu, CEO of Kuzu' is now available on YouTube. See it here: bit.ly/3U0iBgT #Kuzu #graphdatabases #graphvisualization #graphtechnology

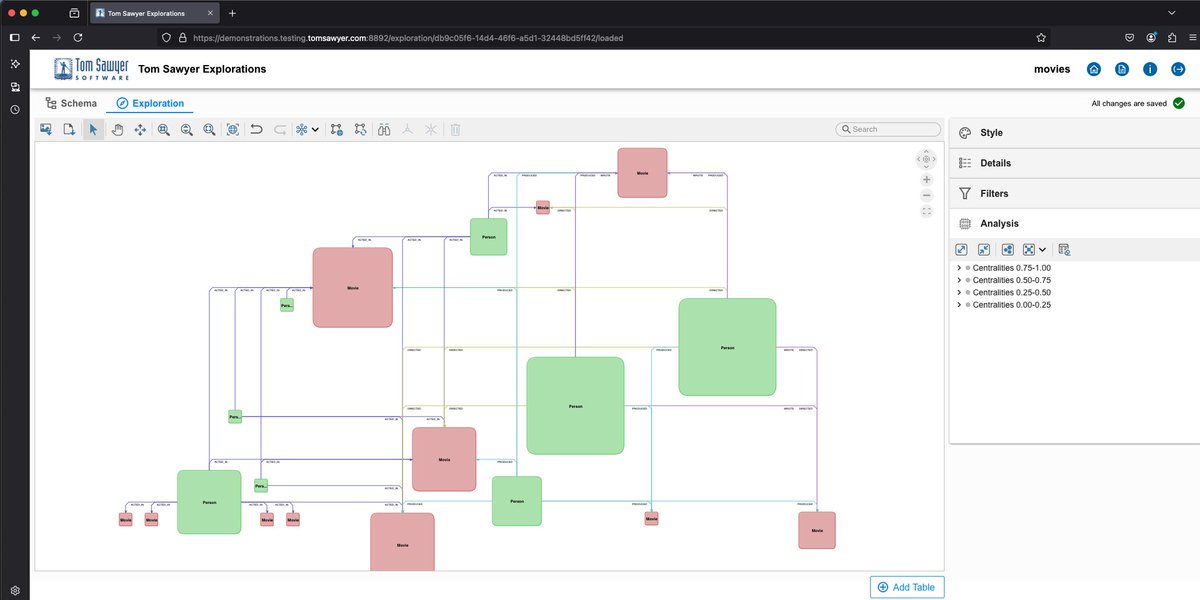
With Tom Sawyer Explorations you can connect, query, and run social network analysis in your data in under a minute! Learn more: bit.ly/44TAqo0 #graphdatabases #analysis #graphvisualization #graphtechnology
Curious about integrating advanced web components into your #Angular application? Check out how Tom Sawyer Perspectives makes it easy with this step-by-step guide! Build and innovate today: bit.ly/4kj2SUG #sql #graphdatabases #graphvisualization #graphtechnology
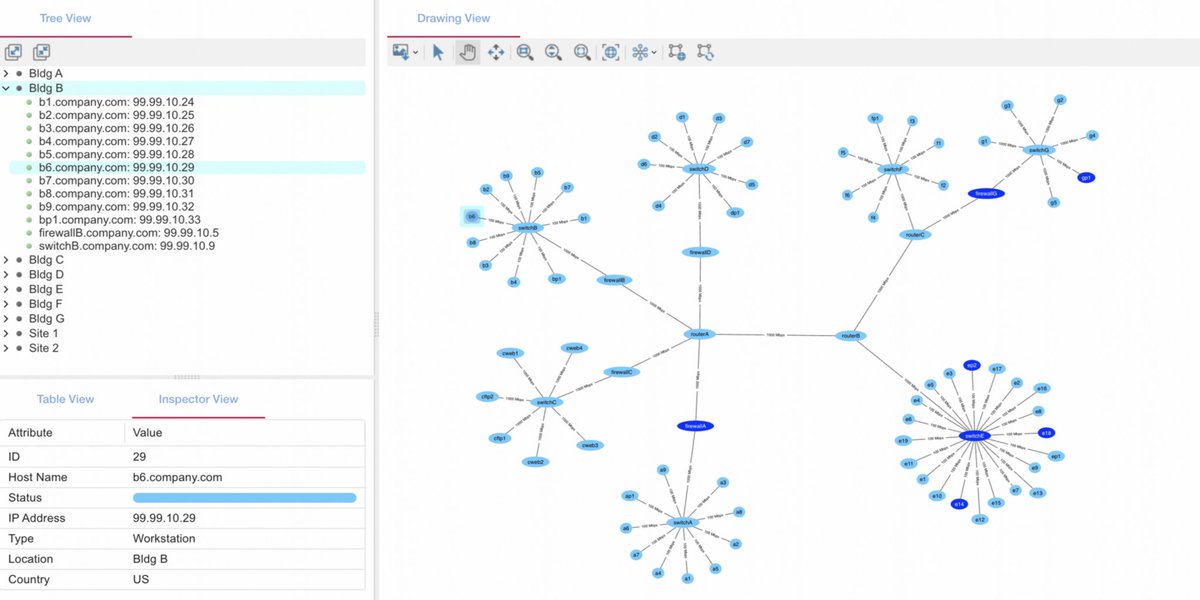
Curious about the structure of your #data? Use Perspectives to uncover connections, extract key details, and reveal metadata effortlessly. Insights are just a click away! bit.ly/449177H #dataops #graphvisualization #graphtechnology

In our most recent blog post, we discuss DOT graph visualization. Learn about its strengths, limitations, and how modern tools like Tom Sawyer Perspectives enable dynamic, interactive system diagrams. 🔵📈 #graphvisualization #tomsawyersoftware #tomsa... bit.ly/3ZEzt03
Perspectives Feature: Hierarchical layout offers a choice between routing backward edges directly, or looping to better indicate the overall flow. Check out examples at bit.ly/43HVlZp #dataanalysis #graphvisualization #graphtechnology

Visualize Bus elements for Internal Block and Parametric diagrams with custom colors with Tom Sawyer Software. bit.ly/43Bo3eo #mbse #sysml #systemsthinking #graphvisualization #graphtechnology


Heatmaps are now available in Data Explorer for @neo4j v2! Use color-coded maps to visualize patterns in your graph and gain new insights. Analyze your data with ease and try it free: yworks.com/neo4j-explorer #Neo4j #DataExplorer #GraphVisualization #DataScience
Our latest blog post is about Vue Graph Visualization! Learn how to build high-performance, interactive graph visualizations in Vue.js using top libraries like Chart.js, D3, ECharts, Vis.js, and more. 📈 #vue #javascript #graphvisualization #graphtech... bit.ly/43E20F8
Unravel complex crime networks with our cutting-edge graph views powered by analysis algorithms. See connections, patterns, and insights like never before. Learn more: bit.ly/4k5Q593 #dataops #analytics #graphvisualization #graphtechnology

Our latest blog post is about spatial temporal scene graph visualization! Learn how spatial temporal scene graph visualization helps model and explore dynamic systems across time and space for smarter, real-time decision-making. ⌚️ #graphvisualization... bit.ly/4kmj5sT
Don't miss out! Join us with guest speaker Tim Weilkiens to see how AI is transforming MBSE workflows, reducing effort & improving consistency. Register for this free webinar: bit.ly/4d5bgoO #MBSE #SysMLv2 #AI #Webinar #graphtechnology #graphvisualization

SysML v2 & AI: The Perfect Pair? Learn AI-powered modeling with SysML v2 from the expert and guest speaker @TimWeilkiens (oose CEO). Practical insights & live demo. Register today: bit.ly/42QU96Q #MBSE #SysMLv2 #AI #Webinar #graphtechnology #graphvisualization

Join us May 9th at The Knowledge Graph Conference to see our demo and take part in the Q&A on how Tom Sawyer Perspectives helps you to transform your data into actionable insights. bit.ly/4iXuMox #KGC2025 #knowledgegraphs #graphtechnology #graphvisualization
In our latest blog, we discuss Python graph visualization libraries including Plotly, Pyvis, Graphviz, and NetworkX. Learn their features, compare tools, and find the best fit for your data science or analytics project! 🐍 #python #graphvisualization ... bit.ly/3ENohHa