Search results for #tidyplots

This is how you can save intermediate stages of #tidyplots by using `save_plot()` in the middle of a pipeline 💡 #rstats #dataviz #phd


You can easily export your #tidyplots in various formats by chaining multiple save_plot() functions together. This is a handy trick for efficiently creating and saving visualizations in different file types during your workflow. Thanks for sharing this tip, @JanBroderEngler.…
You can easily export your #tidyplots in various formats by chaining multiple save_plot() functions together. This is a handy trick for efficiently creating and saving visualizations in different file types during your workflow. Thanks for sharing this tip, @JanBroderEngler.…
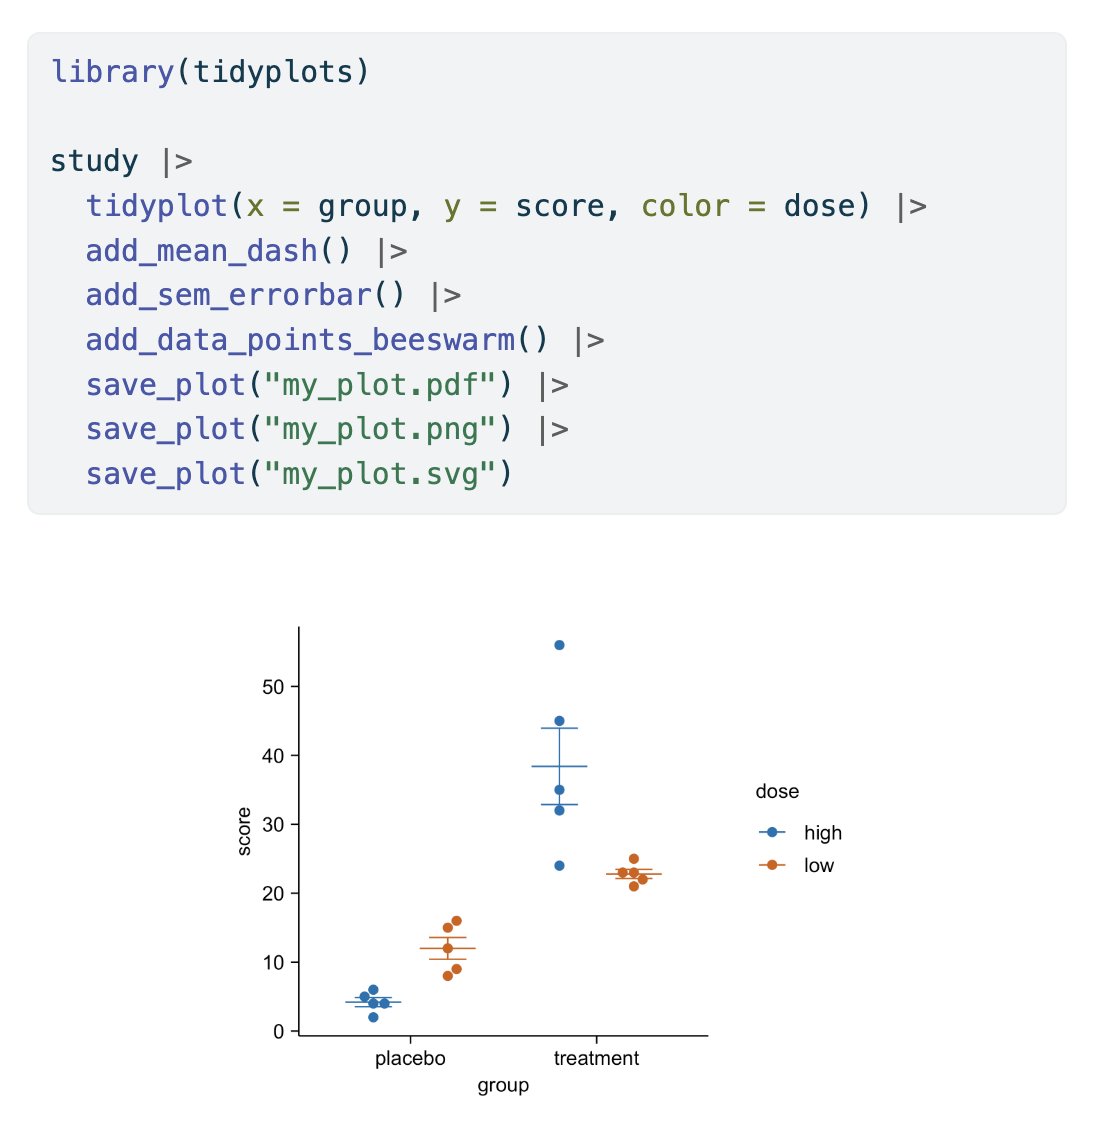
You can save #tidyplots in multiple formats by piping through multiple rounds of `save_plot()` 🤩 #rstats #dataviz #phd
🥳 Woohoo! #tidyplots just hit 600 stars on GitHub 🤩 Huge thanks to all supporters! tidyplots.org doi.org/10.1002/imt2.7… #rstats #dataviz #phd

This is how you can generate multiple PDF files at once in #tidyplots 🚀 #rstats #dataviz #phd

This is how you can generate multipage PDFs in #tidyplots 🪼 #rstats #dataviz #phd


Each variable is a column, Each observation is a row. Each type of observational unit is a table.#tidyplots
Each variable is a column, Each observation is a row. Each type of observational unit is a table.#tidyplots

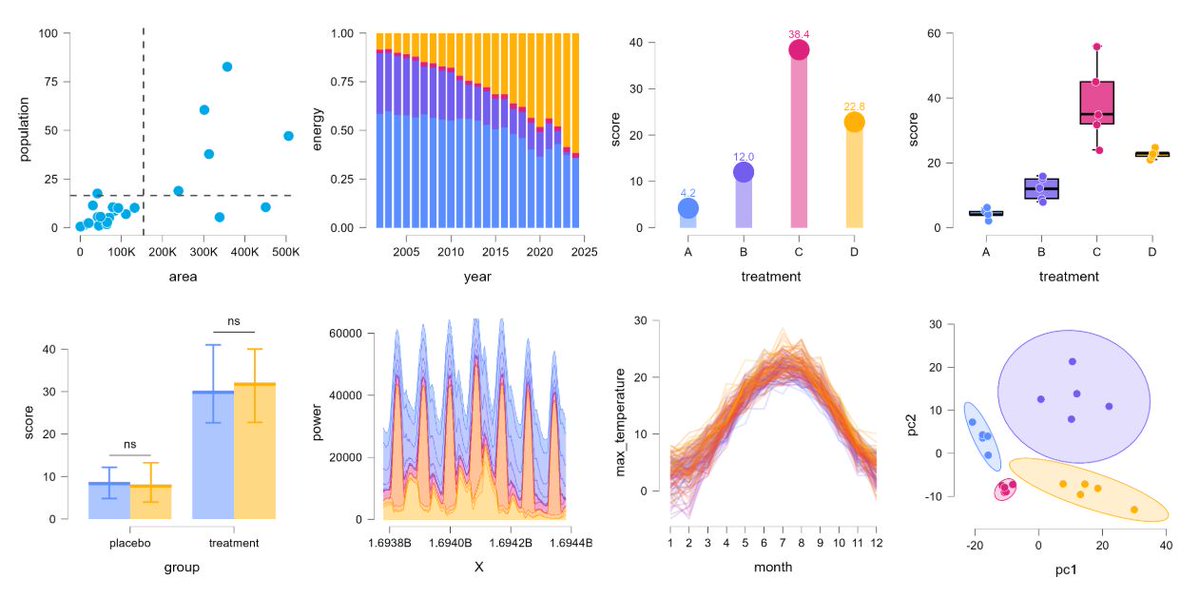
This is how you can split a plot into multiple subplots using #tidyplots 🚀 #rstats #dataviz #phd
A great example of how to effectively visualize time course data using the #tidyplots package. Clear visuals like these can make complex trends much easier to interpret over time. Thanks for sharing this insight, @JanBroderEngler. #rstats #datavisualization #DataScience…
A great example of how to effectively visualize time course data using the #tidyplots package. Clear visuals like these can make complex trends much easier to interpret over time. Thanks for sharing this insight, @JanBroderEngler. #rstats #datavisualization #DataScience…
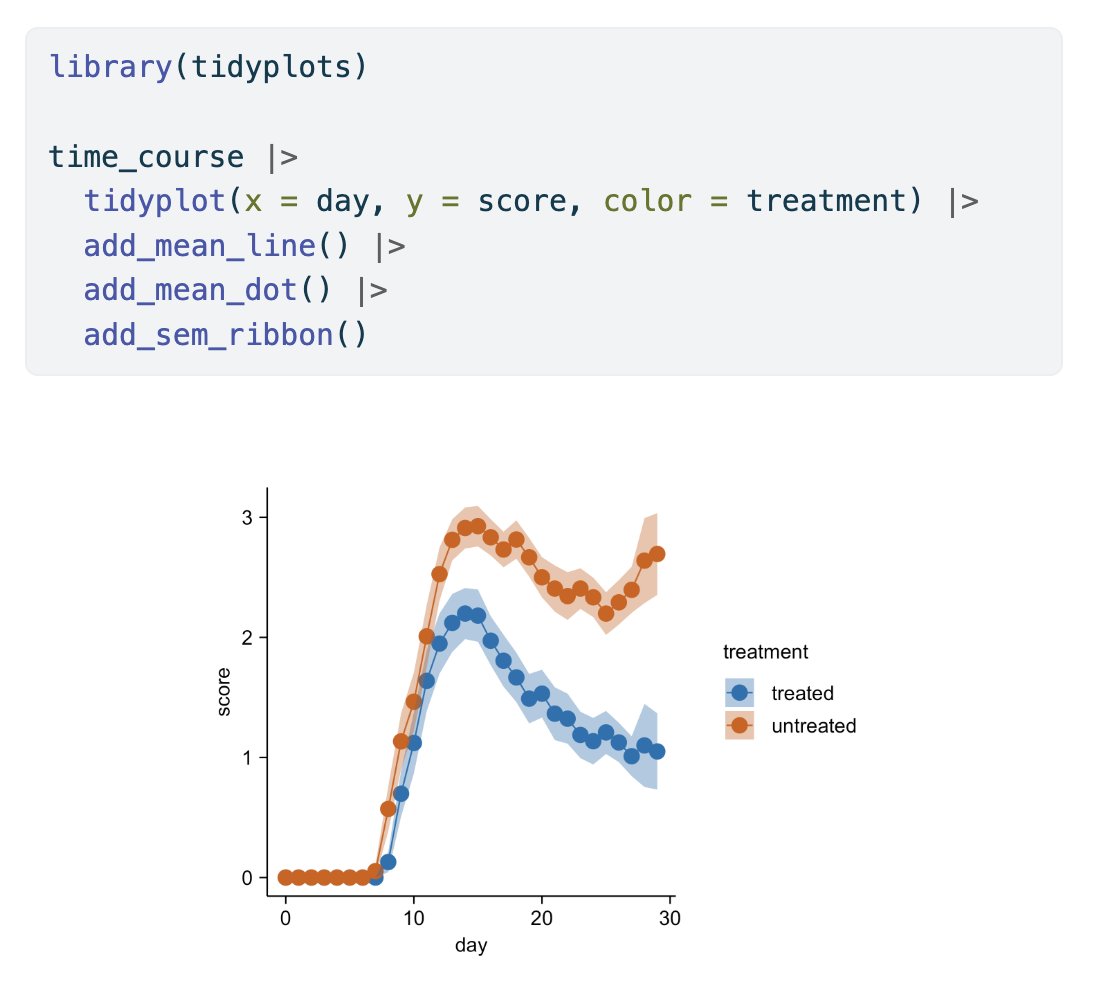
This is how you can visualize time course data in #tidyplots ⏱️ #rstats #dataviz #phd
The Plot Builder in #JASP 0.95.0 is now powered by #tidyplots 🚀 Kudos to @matyasbukva JASP is an open-source statistical software suite with a graphical user interface for conducting classical and Bayesian analyses. jasp-stats.org #rstats #dataviz #phd
Thank you for citing #tidyplots 🙏 Tomohiro Ishii et al. Pericyte-mediated regulation of angiogenesis during cutaneous wound healing in adult zebrafish. Communications Biology (2025). doi.org/10.1038/s42003… #rstats #dataviz #phd
Thank you for citing #tidyplots 🙏 Maria J. Pereira et al. Depot-specific metabolic and inflammatory profiles in perirenal and renal sinus adipose tissue, Molecular Medicine (2025). doi.org/10.1186/s10020… #rstats #dataviz #phd
#RStats Get started with #tidyplots
#RStats Get started with #tidyplots

This is how to get started with #tidyplots 🚀 tidyplots.org/getstarted #rstats #dataviz #phd
This is how you can generate lollipop charts in #tidyplots 🍭 #rstats #dataviz #phd

This is how you can generate donut charts in #tidyplots 🍩 #rstats #dataviz #phd

This is how you can add data values in #tidyplots 🏆 #rstats #dataviz #phd

This is how you can guide attention in #tidyplots 0.3.1 🎯 #rstats #dataviz #phd

Being free and open-source, this is how you can support #tidyplots ❤️ tidyplots.org #rstats #dataviz #phd
