As the clock struck midnight in the Asia Pacific time zone, I celebrated not only my 35th birthday but also my 13th year of learning within the FinTwit community. Within the realm of solitary trading, there are often instances when the sole source of joy, particularly during a lacklustre market period, is through acts of generosity. With that in mind, I would like to take this moment to express my deep gratitude for the years of selfless education I have received as a silent reader, along with the intellectually stimulating discussions held within this community. Furthermore, I wish to take this opportunity to delve into the purpose and significance of maintaining a daily market diary, as it plays a vital role in your development and growth as a trader. It serves as a navigational tool, keeping you closely on track with market movements, situational awareness and helping to curb over-trading beyond your prepared watchlist. Finally, I would like to extend my gratitude to the following Twitter accounts that have greatly contributed to the development of my market diary over the years. 1. @finitrades - Selfless sharing of Notes & Watchlist Template, with trading style heavily influenced by @Qullamaggie. His google doc also has a whole list of great hyperlinks to @Quallamaggie's material 2. Ben Bennett - Mid-Week market technical analysis on youtube and twitter, was watching it since 2015. 3. @cfromhertz - Daily Market Recap video is the first thing I watch in my morning since i found it on 2017! Demonstrating genuine passion for the market by consistently producing a 20-minute video every day since 2015! 4. Mike Prechter - An ideal mentor who effectively communicates about risk back in 2010s in twitter. Rumored to be the Phantom from 'Phantom of the Pits' . Greatly missed! 5. @alphacharts365 - State of The Market (SOTM) video is my Sunday evening's ritual. No BS, simply clean charts on both daily and weekly of market, key sectors, bonds, vix, credit spread, and I love the new HG1!/GD1! relative strength between copper and gold to access economic growth. 6. @RichardMoglen - after SOTM, I will be watching Richard's Stock Market Outlook. Richard deserves recognition not only for his skill as an interviewer of great traders but also for his dedicated efforts in creating informative watchlist and stock market outlook videos. By increasing the playback speed to 1.25 for both @alphacharts365 and @RichardMoglen videos, you can effectively cover the content within 20 minutes. This allows you to not only obtain a second opinion but also a third opinion, enabling you to keep your own market analysis and biases in check. 7. @LeifSoreide - An aspect of my diary is the breakdown of the sub-market such as $IJS, $IJT, $IJJ, $IJK, $IVE, and $IVW. This was an influenced from Leif. 8. @PrimeTrading_ - Alex consistently shares his daily leading sector scans and a meticulously curated watchlist of stocks. His watchlist comprises only those stocks that meet stringent criteria based on fundamental metrics, relative strength, technical analysis, and his proprietary scoring system known as PRIME Score. Additionally, his proficiency in spreadsheet formulas has inspired me to maintain my own spreadsheet in a sleek and organized manner. So here we go! 1/n

1. Date (Why it is 1-Day after the Market Close) As most of you are aware, I am a Singaporean trader who primarily operates within the Asia Pacific time zone, even when I frequently travel on short-haul flights. It's worth noting that, like many others, I have regular sleeping patterns even while trading the US market. Therefore, when I wake up, my first task is to prepare my market diary, which includes pre and post-market analysis. However, since I am already in the Asia Pacific region (GMT +8 currently), my diary is typically dated a day later due to the time difference. I strive to maintain my focus and align my travels within a time zone range of +2/-2. This approach allows me to capitalize on the advantage of preparing my pre-market and post-market work when my mind is at its freshest state in the morning. At this stage of my life, I approach trading with utmost seriousness as it plays a crucial role in funding not only my own needs but also those of my two retired separated parents. Additionally, I rely on trading to support the growth of my leveraged real estate portfolio, which currently exceeding 10 million dollars. For those traders based in the Asia time zone who are curious about my approach to managing US trading, below is a response that I frequently copy and paste to address this topic. " 1. I make it a habit to wake up before 8.30am GMT+8 every day, and ensure that my pre-market tasks are completed before the US market opens at 9.30pm GMT+8. I usually complete them before my lunch. 2. What occupies me after are usually reading, fitness hobbies, youtube @Qullamaggie streams, coffee, culinary, and admisntrative for my real estate holding business 3. To ensure that I am well-rested and alert, I make it a point to go to bed before 2.30am GMT+8 every day. Thus, I developed the habit of avoiding executing market orders after the US lunch session. 4. During weekday evenings, I prioritize trading and do not socialize much. It probably been almost a decade since I ever stepped into a pub on a weekday evening. As a trader based in the Asia & (EU timezones previously and during travel), 5. I find it important to maintain relationships, as trading can be a solitary activity. But I am highly motivated to achieve a certain level of net worth before I turn 40 and I have the skill and tools for it. I am currently 35.' '' 2/n
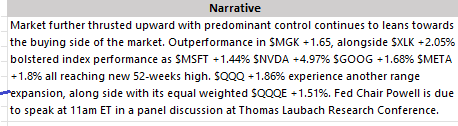
2. Narrative Recap of previous day's action, my observation, and potential marketing moving events for the day. Most of the market movers at index, sectoral or group level are also captured and easily visualized in the other sections of the diary.
3. Short Term Breath $MMTW (% Of Stocks Above 20-MA) $MMTW is an oscillator that can be utilized as a breath indicator to assess the internal strength and weakness of the underlying index by analyzing the percentage of stocks trading above a 20-MA. I recommend referring to the historical data I extracted in the tweet below to comprehend why I emphasize using a threshold of >50% as an indication of a bullish bias in the overall market, specifically when 10-MA is above 20-MA at index level. x.com/jeffsuntrading…
4. Short Term Breath NH/NL (New Highs - New Lows of 52 Weeks Level) The number displays the daily difference between the number of stocks reaching new 52-week highs and the number of stocks reaching new 52-week lows across Nasdaq, NYSE and AMEA. There are various sources you could extract this data but the most comprehensive one would be barchart.com/stocks/highs-l… If you are a TradingView user, you may search for the below 2 indicators of different variation; 1. @DumbleDax - 'Net New Highs/Lows (with visible code) by Fred6724 2. @Trader_mcaruso - 'US Markets Net Hew Highs/Lows by CarusoInsights
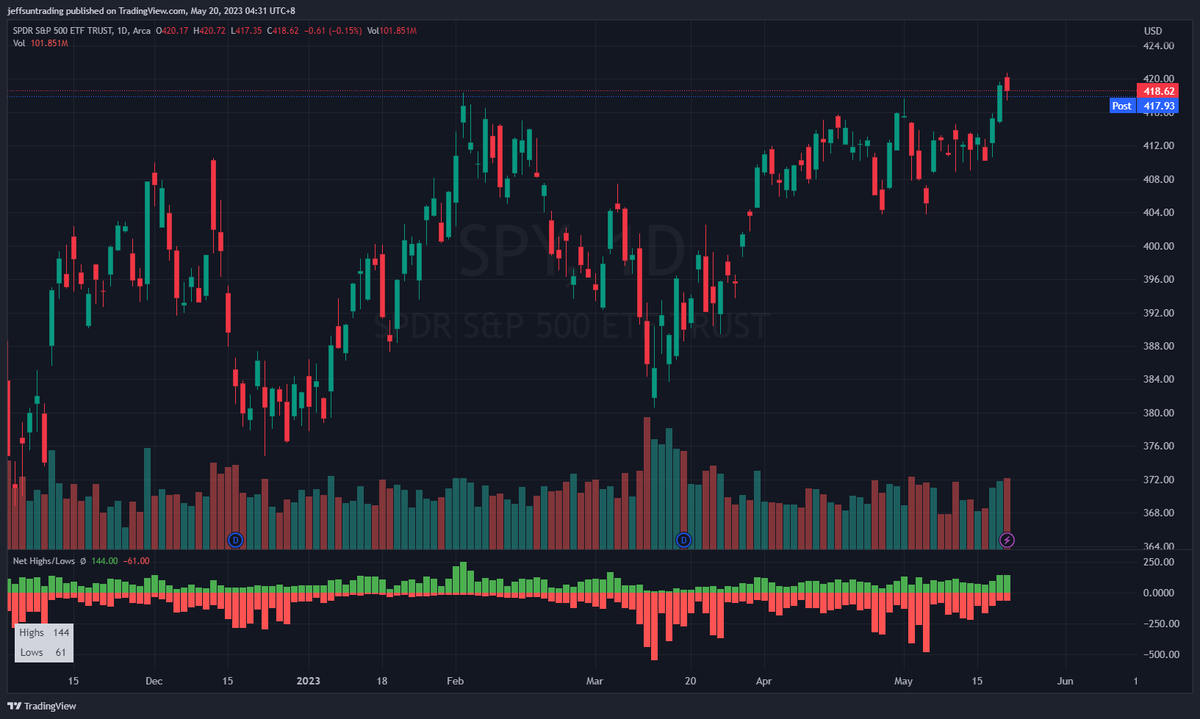
5. Market Level $RSP $QQQE $IWM 1. $RSP (equal weight of cap weighted $SPY) 2. $QQQE (equal weight of cap weighted $QQQ) -Equal weighted representation means that each stock within the index carries the same weight. This provides a more balance representation of the overall market performance compared to the capitalization weighted counterpart, and thus a more comprehensive overview of market trend. -2023 has been a great illustration how cap-weighted $SPY and $QQQ has been skew to the overall market analysis as the rally in those indexes has been towards a few dominantly mega cap players. -The weakness in ratio of $RSP/$SPY, $QQQE/$QQQ, which reflects the relative weakness of the numerator, which in this case are $RSP and $QQQE, allows potential early detection of weakness as the equal-weighted index could give earlier indications of broader market trends. 3. $IWM (cap weighted but 2000 stocks) $IWM offers several benefits in market analysis. -Direct analysis of performance and trends from a diverse range of smaller companies across various sectors and industries, which may differs from broader market represented by $SPY $QQQ -Small-cap stocks are generally more sensitive to changes in the domestic economy than large-cap stocks. As a result, $IWM can serve as a leading index to $SPY and $QQQ

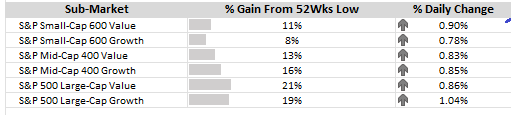
6. Sub-Market Level I utilize the breakdown provided by @iShares, consisting of $IJS, $IJT, $IJJ, $IJK, $IVE, and $IVW, primarily to assess outperformance and underperformance based on daily % changes. This breakdown forms part of my framework for conducting deeper analysis of market cap adjustments in my daily scans, whenever necessary.
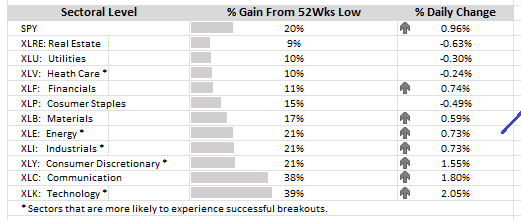
7. Sectoral Level Comparing the strength of the 11 SPDR sectors offered by @StateStreetGA can be done by assessing the percentage gain from their respective 52-week lows. This is in simplciity of course, as ADR& of each sector is not taken into account. eg. $XLE is trading at ADR% of 2.09% vs $XLP at ADR% of 0.84%, more than doubling its volatility. Conversely, analyzing the percentage loss from their 52-week highs would provide a comparison of weakness. There are 5 particular sectors that hold a prominent position in my watchlist, indicated by an asterisk (*). For a clearer understanding, I invite you to refer to the recent thread I created on this topic. x.com/jeffsuntrading…
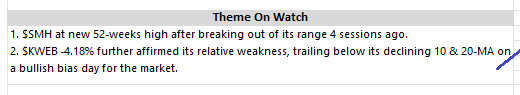
8. Theme On Watch I take pride in my narrative and observations regarding the key movers and highlights of thematic groups. Notably, I am pleased with my call for $KWEB relative strength back in November, the breakdown in $KBE and $KRE in early March, and the recent rally in $SMH before 12th May
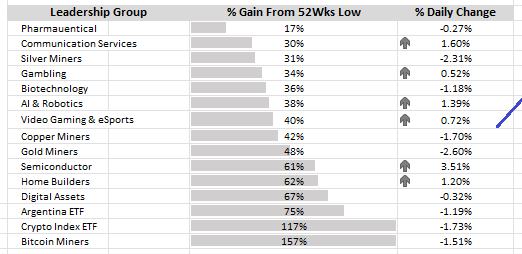
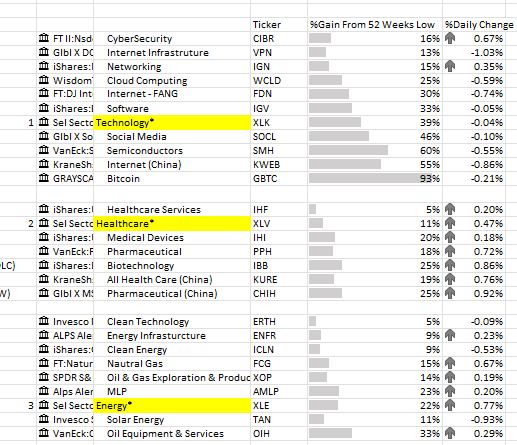
9. Leading Industry Group When it comes to assessing leading industry groups, there are several approaches one can take, considering that the subdivisions into industry groups can vary depending on the classification system used. Two widely recognized systems are the North American Industry Classification System (NAICS) provided by @NAICSCode and the Global Industry Classification Standard (GICS) offered by @MSCI_Inc and @SPDJIndices. Another approach I employ is based on available ETFs that are tradable in the market.
Let me take a break here. The Focus and Stalk section encompasses a wide range of information and I'm attempting to establish a structure to effectively convey and articulate it.
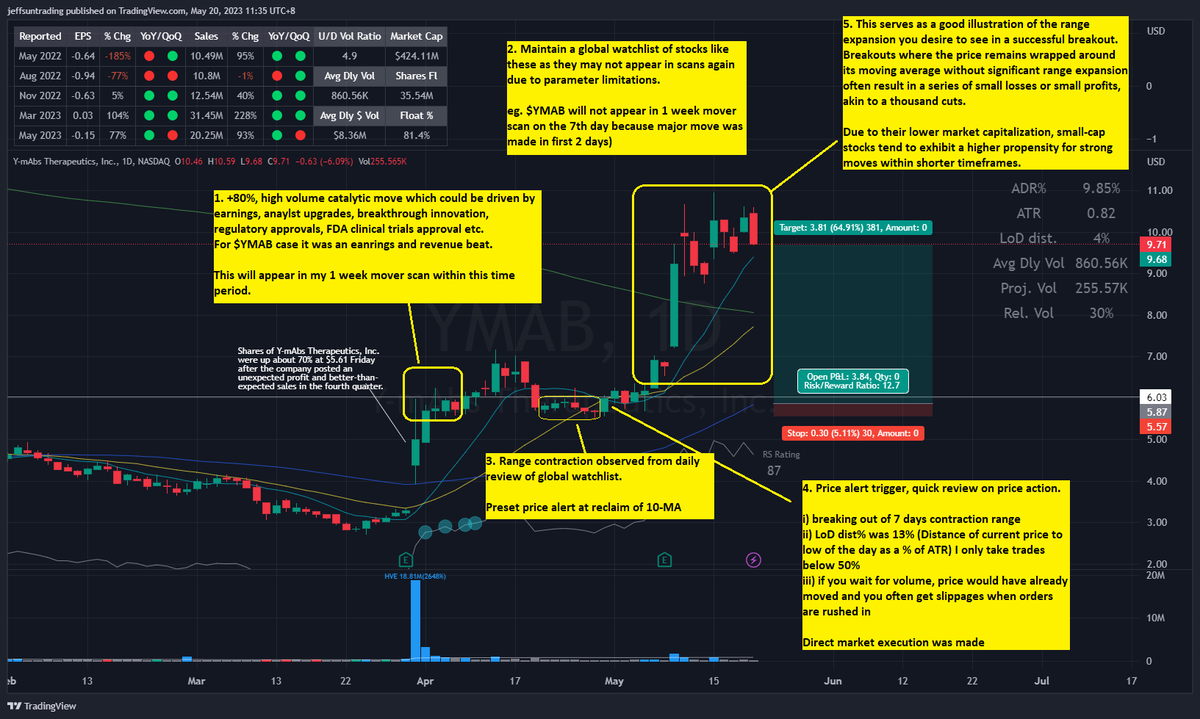
10. Focus List (Part 1) Before we proceed, I kindly request you to refer to the link below for the configuration of my charting template and the indicators that I find particularly valuable. x.com/jeffsuntrading… i) Setups & Execution Primarily, my trading revolves around setups involving range breakouts of high momentum stocks. To delve deeper into this strategy, I aim to enter trades before the range expands following a period of contraction. I specifically look for stocks that have recently shown accumulation, and my main scans typically focus on significant percentage gains over various timeframes such as 1 week, 1 month, 3 months, and 6 months. in $YMAB trade, the following fulfills my criteria when it appeared in my scan i) Strong catalytic move with high volume. Many notable breakouts on their second leg of the rally often stem from a price + volume disrupted rally within stage 4 bases. ii) High ADR% equate to momentum is in place, and could often mean stronger price expansion moves are just ahead iii) Strong RS iv) Volume Dry Up (not definite criteria in my case) v) Price contraction above above short term moving averages (10 & 20-MA primarily) refer to the image below for illustration of $YMAB, along with Execution This was another discussion early in the week before $BLPH broke out +20% on a 1 day move x.com/jeffsuntrading…
10. Focus List (Part 1) Before we proceed, I kindly request you to refer to the link below for the configuration of my charting template and the indicators that I find particularly valuable. x.com/jeffsuntrading… i) Setups & Execution Primarily, my trading revolves around setups involving range breakouts of high momentum stocks. To delve deeper into this strategy, I aim to enter trades before the range expands following a period of contraction. I specifically look for stocks that have recently shown accumulation, and my main scans typically focus on significant percentage gains over various timeframes such as 1 week, 1 month, 3 months, and 6 months. in $YMAB trade, the following fulfills my criteria when it appeared in my scan i) Strong catalytic move with high volume. Many notable breakouts on their second leg of the rally often stem from a price + volume disrupted rally within stage 4 bases. ii) High ADR% equate to momentum is in place, and could often mean stronger price expansion moves are just ahead iii) Strong RS iv) Volume Dry Up (not definite criteria in my case) v) Price contraction above above short term moving averages (10 & 20-MA primarily) refer to the image below for illustration of $YMAB, along with Execution This was another discussion early in the week before $BLPH broke out +20% on a 1 day move x.com/jeffsuntrading…
10. Focus List (Part 2) ii) Watchlist Management Prior to delving into the parameters of my scans, I cannot stress enough the significance of maintaining a comprehensive global watchlist that fulfills criteria but not ripe for action. It is crucial to understand that many actionable stocks that presents lucrative opportunities often emerge a few days or weeks in the scans, rather than on the very day of scanning. If you come across a stock that appears promising but is not yet fully prepared (for instance, lacking price contraction or requiring moving averages to catch up as price undergoes a softening action), it is essential to include it in your global watchlist and diligently monitor it on a daily basis. As I highlighted in the trade below, $YMAB will not appear in a 1 week mover scan on the week it moved. To provide some context, as of now, I have a global watchlist consisting of 142 stocks. I meticulously review this list every day, adding new promising stocks that emerge from my scans and removing any with disrupted price action. Additionally, I also go through over 50+ leveraged ETFs on a daily basis, as they play a significant role in my trading strategy. Trading leveraged ETFs has proven to be a reliable and consistent approach for me. It serves as my bread and butter in the market. Some of my biggest RRR trade are from this segment of the market in the past 6 months, making up for the higher losing rate.

10. Focus List (Part 3) iii) Scans - Finviz Free Version I strongly advocate for utilizing the free tools available on the internet for those who are still striving to become proficient in trading. Trading itself carries significant costs and unforeseen events that can disrupt your equity curve, some of which you may not even be aware of. These include factors such as wide spreads, execution slippages, and locate fees, among others. By leveraging the free tools provided online, you can mitigate some of these costs and gain a deeper understanding of the trading landscape. In my opinion, a good precise strong mover scan should yield less than 60 results. You want the top quality movers. Below is the direct link to the Finviz version of my scans. You can make amendment to include any of your preferred criteria to only streamline the scan, not expand it. 1. 1-Week Mover Exceeding 20% - finviz.com/screener.ashx?… 2. 1-Month Mover Exceeding 30% - finviz.com/screener.ashx?… 3. 1-Month Mover Exceeding 50% (I would toggle to this scan instead if there are too many results appearing in '1-Month Mover Exceeding 30%' due to strong market. The whole idea is to look for the strongest mover of each time period - finviz.com/screener.ashx?… 4. 3-Month Mover Exceeding 50% -finviz.com/screener.ashx?… 5. 6-Month Mover Exceeding 100% - finviz.com/screener.ashx?…

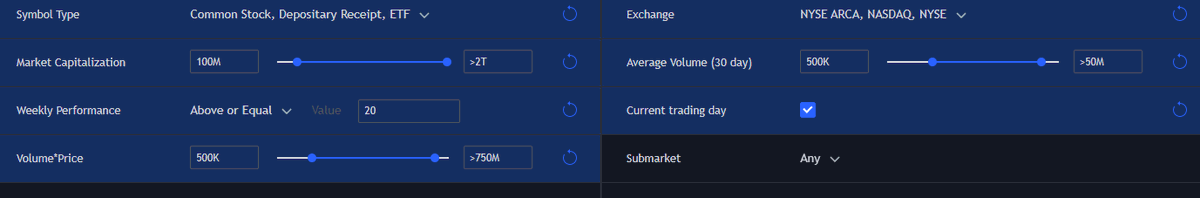
10. Focus List (Part 4) iv) Scans - @tradingview Free Version Below is a Screenshot for parameters of Scan for '1-Week Mover Exceeding 20%' on @tradingview You can do the same adjustment based on the filters from Finviz for each scans on @tradingview Although the parameters for the five scans in Finviz are largely the same, it is interesting to note that some names may not appear on both platforms. If you are proactive, I highly recommend conducting the scans in both platforms.
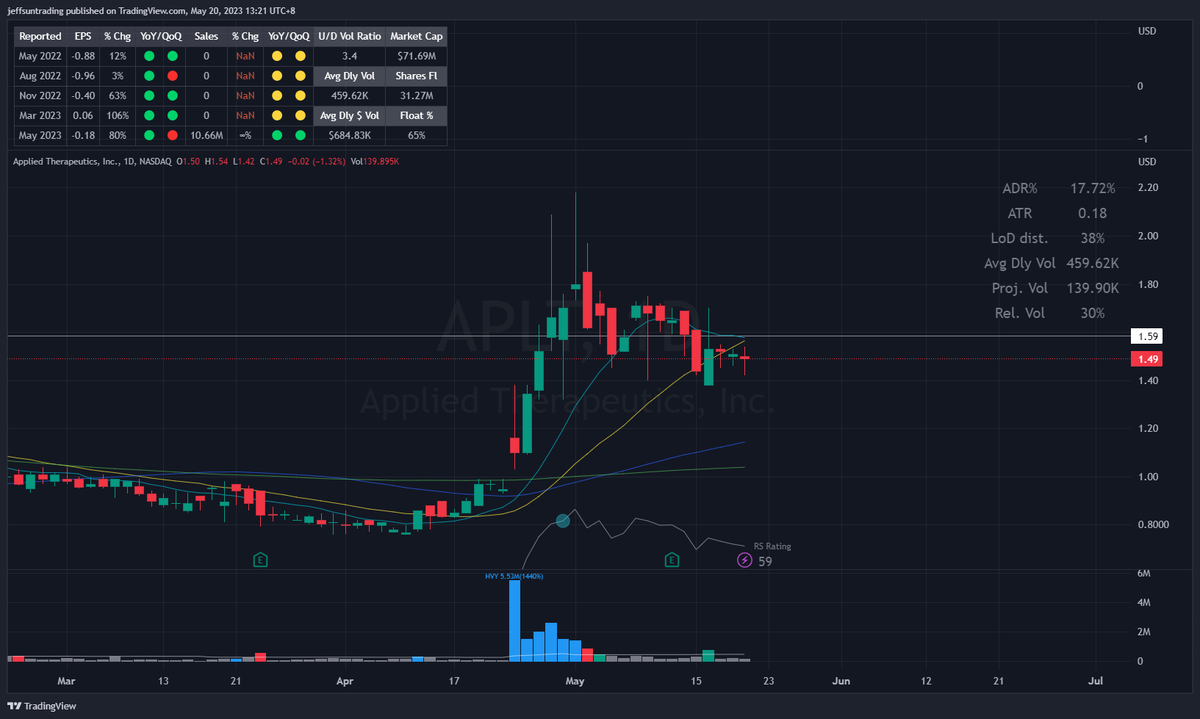
11. Stalk List So in my earlier post, I highlighted on my global watchlist consisting of 142 stocks (at the point of writing) which I meticulously review this list every day, adding new promising stocks that emerge from my scans and removing any with disrupted price action. From reviewing this 142 stocks in my global watchlist, I further pick out stocks that are building their short term bases but remains early for substantial moves in my opinion. This could be due to the following; i) Upcoming earnings. I typically avoid trading stocks with upcoming earnings within the next five days. However, I am willing to consider trades with an earnings leeway of six days or more. This could either give me substantial profit cushion into earnings, or sufficient allowance for pre earnings day exit. ii) Price softening, but remains loose and seeking more price tightening. Range contraction in Focus List remember? iii) 10, 20-MA have not yet catch up the softening price action iv) Running into Declining Major MA (Specifically 200-MA), many of such breakout trades beneath an approaching declining 200-MA failed miserably in history, especially this year. If there's at least a 3xADR& distance in the build up, I will still upgrade them to Focus List. iv) Below 10, 20-MA but trailing it closely. $APLT in the chart below is a great illustration. $1.59 price alert for recapturing above 10-MA. I want to stress that there is a chance of trading the stocks mentioned in my Stalk section on the same day. This typically happens when a stock gaps up from its previous close, presenting an advantageous entry opportunity as the price has already exceeded the breakout level of a range but remaining tight from it's % LoD dist. While I may not strictly adhere to all the criteria in such cases, you can be certain I will make any execution that allow me to enter at extremely high lucrative risk reward based on LoD distance % beyond pivot.
12. I have reached the conclusion to give you an overview of how I maintain a daily market diary, and I hope you recognize the significance it holds in your development and growth as a trader from the process of doing it. This diary serves as a valuable navigational tool, keeping you closely aligned with market movements, enhancing your situational awareness, and helping to prevent excessive trading outside of your prepared watchlist. Having shared all the insights, I eagerly anticipate your future engagement with my Market Diary postings. I invite you to join the discussion, where we can exchange ideas, provide commentary, and even respectfully disagree based on our individual analyses of different market levels. As a perpetual learner in the market, I greatly value intellectually stimulating discussions and welcome the opportunity to engage in such conversations with you.
If you believe that this thread can contribute value to the community, I kindly request your support through liking and retweeting the thread as my birthday gift! My ultimate goal is to promote trading literacy and encourage more focused and insightful discussions within the FinTwit community. Your engagement will greatly contribute to fostering a culture of concise and informative dialogue that would grow the community together.
13. My pre-market routine x.com/jfsrevg/status…

@jeffsuntrading Solid thread, my friend. Keep killing it! 🔥💪

@jeffsuntrading This is so incredibly awesome Jeff 🙏 Best fintwit thread I've ever read! I'm learning so much from you. I wanna thank you from the bottom of my heart for taking the time to educate us in such an extensive and meticulous way. And congrats with your 35th birthday 🎂 🥳

@jeffsuntrading Happy birthday! Excellent thread - a birthday gift for us all 👍

@jfsrevg Life is filled with pleasant surprises and strange & unexpected detours. 😀 It was @Clement_Ang17 mentioning @jfsrevg 🙏 him for ideas as the guest blogger for @KayKlingson how to be successful being a part-time trader which lead me to you. Thank you for the generous share!

@jeffsuntrading Incredible! Generous, thoughtful, clear and concise! Once again, thank you very much and very grateful🙏🙏🙏
@jeffsuntrading You are my absolute favorite fintwit mentor. Followed by Kristjan Kullamägi 😉 Wishing you all the best with your endeavors!


@jeffsuntrading Great read! One thing I've been struggling with is exiting a trade. I'm currently doing a post analysis of all my trades this year to identify better exits. Would love to hear your thoughts on this in the future.

@jfsrevg I wish I have read your X posts one year earlier! It's never too late to learn and improve. Thank you for sharing.


@jeffsuntrading how long you maintain this as daily discipline?