
The ATR% Multiples From 50-MA signal is further enhanced. Big credits to @DumbleDax and all the suggestions and contributions from you guys! 1. Corrected the calculation to use a % base for detection - Used the high of the candle as a reference for the detection to remain on the chart even if it is resold 2. Added an optional table 3. Modified the multiple to default by '10'. This is suitable if you are trading around high beta, high adr% name. If not you can adjust the multiples lower to 7 on my recommendation. 4. Works on weekly tradingview.com/script/oimVgV7…
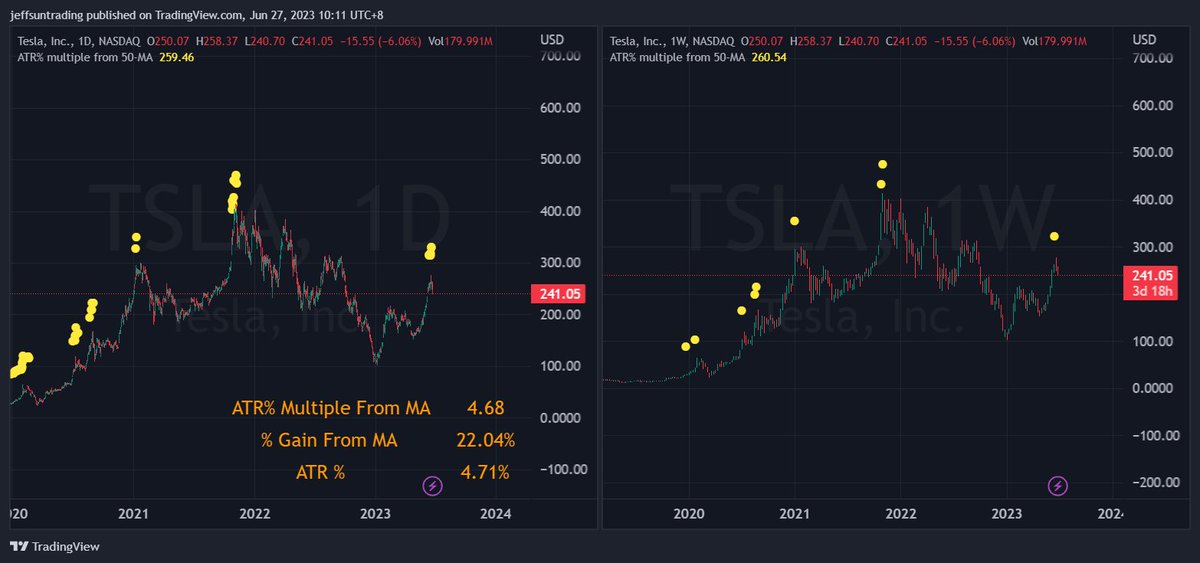
The ATR% Multiples From 50-MA signal is further enhanced. Big credits to @DumbleDax and all the suggestions and contributions from you guys! 1. Corrected the calculation to use a % base for detection - Used the high of the candle as a reference for the detection to remain on the chart even if it is resold 2. Added an optional table 3. Modified the multiple to default by '10'. This is suitable if you are trading around high beta, high adr% name. If not you can adjust the multiples lower to 7 on my recommendation. 4. Works on weekly tradingview.com/script/oimVgV7…


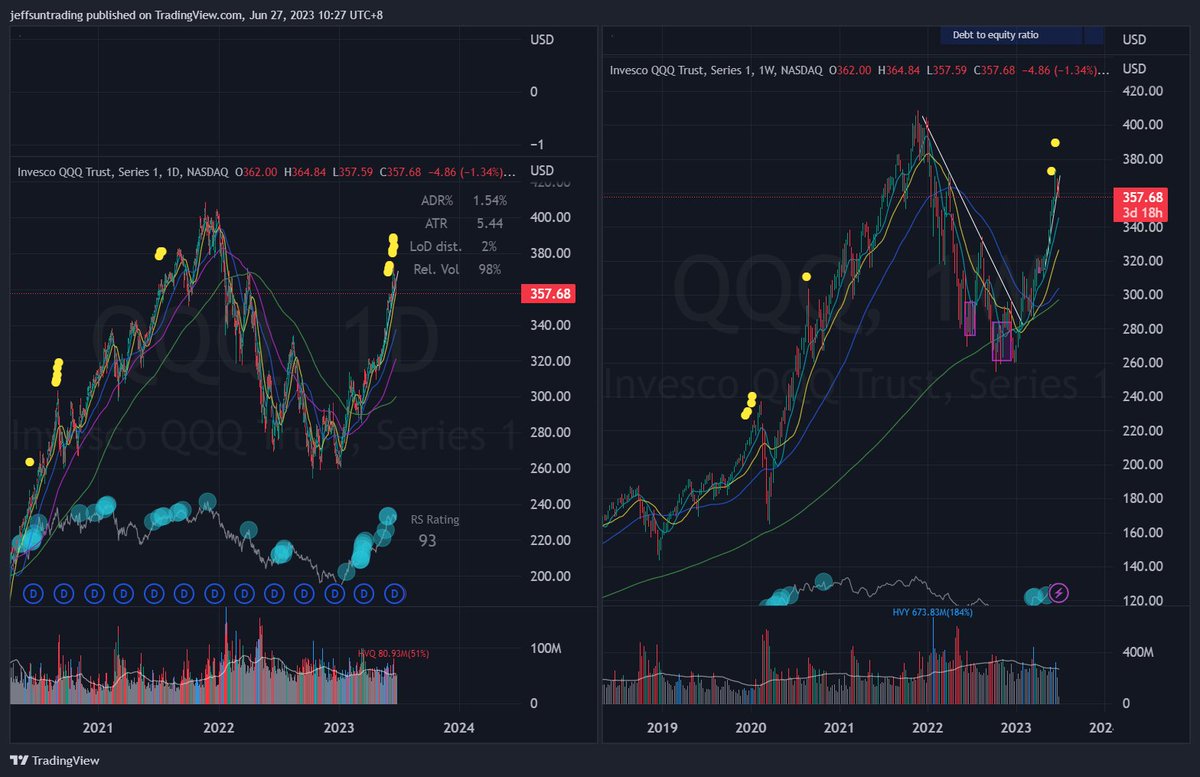
Lower ADR% ticker such as Indexes, I will employ '7' instead of '10' Example on $QQQ

@jfsrevg @DumbleDax Great indicator Jeff, I made something similar a while back. Another good option to keep it objective that works well is to simply use an RSI with slight tweaks to the settings for more extreme readings. Not perfect but does the job too.

@jfsrevg @DumbleDax Here is an approximation of this as an indicator in TC2000: iif( 100*((c-avgc50)/avgc50) / (100*(ATR30/c)) >= 10 ,L,0) Can change the ATR lookback period as desired.

@jfsrevg @DumbleDax Jeff, the % Gain from MA seems to be based on the close, not on the high. For example $SNOW high on 11/30 is 13.25% from 10 MA. Indicator states 10.33%, which is the correct for the closing price. Also the ATR% is based on closing price, not high price.

@jfsrevg @DumbleDax I’ve used this ATR multiple technique since the 1990’s and just pass along an idea… Find the dominant cycle in the market for your particular timeframe, (D,W,M) and set MA to half the cycle length. Oh, and ATR % is definitely preferred.

@jfsrevg @DumbleDax Thanks, this is interesting. I use Bollinger Band width percentage to signal when stocks are extended. I usually take swing profits when BBW level is greater than 100% of the past year.


@jfsrevg @DumbleDax Is there a way to not show "% Gain From MA" and "ATR %" rows like yours? I played around with the settings and seems that I can only show/hide the entire table.
@jfsrevg @DumbleDax Awesome work! Thanks for sharing

@jfsrevg @DumbleDax Thank you Jeff. Mind answering one more question? Looking at $SMCI on Tradingview with ATR%50ma added, You'd ve sold around $250 If you re-entered at around $271 (new high), at around $344 there is no signal. What would be your exit plan at that point? Do you change variables?

@jfsrevg @DumbleDax Is this a modified version of keltner bands which calculates difference between close and 20ema in terms of atr
@jfsrevg @DumbleDax Jeff, sorry if this has been asked already, but can your 10 ATR% multiple calculation also be used with ADR% instead? I know they're technically different but was just curious

@jfsrevg When the ATR% multiple surpasses 8% above the 50-MA for this stock amidst a breakout following a month of consolidation, what's the optimal timing to secure profits? 10%?


@jfsrevg @DumbleDax Jeff, I've been contemplating whether to pursue the CMT or CFTe... would be interested to know why you chose CFTe. Did you consider the CMT?

@jfsrevg @DumbleDax Why do you use 50 day SMA (?) and not 20 day? Also, why not EMA?

@jfsrevg @DumbleDax Really helpful Jeff, thanks. After how many months of data since the beginning of the uptrend becomes more reliable?

@jfsrevg @DumbleDax Yo Jeff. I wanted to combine this with your other script. Here is my first attempt at it -> tradingview.com/script/qxlEgbA…


