
$KC - A Breakdown of My Trade on $KC's +180% Move in a Month (Scans, Watchlist Management, Entry Day Insights, and Systematic Risk Management for Holding) Rather than replying to individual DMs about my $KC position (ironically, my earlier post was about $FBTC), I decided it’s better to share this as part of the free educational content for everyone to benefit from. Here are a few key points about the share structure of $KC before the breakout, so you can adjust your screening parameters if needed. This is the type of stock profile that typically shows up in the 'Top 100 Performance% Stocks' annually. It's also why I tend to focus on small to mid-cap stocks most of the time. Share Structure Before Breakout at $3 i) Market Cap: $700M USD (Current: $2B USD) ii) ADR%: 5.7% (Current: 10.8%) iii) IPO Timer: 4.5 Years ago iv) Outstanding Share Float: 250M v) Avg (50) $ Vol: $35M USD/day vi) Avg (50) Share Volume: 4M/day 1. 1st move back above 200-MA after 1 year, +80% with RS during the 2 weeks. $KC will initially show up on your '1-Month Strongest Move' screener. I move the entire list (which includes $KC) to my watchlist, awaiting a higher low swing to confirm a character change. 2. Higher Low may be in place at this point with price contraction within a symmetrical triangle. I abolutely pay more attention to stocks when price contract along with ALL moving averages contracts together. (10, 20, 50, 100, 150, 200 DMA) $KC remains in watchlist, but will begin to keep appearing in my 'Screener within Watchlist' based on technical price compression. 3. Entry day on 5/11; here are some qualification i) it broke out of a 2 week technical triangle pattern and consolidated range ii) it broke out with high RVOL (RVOL was 40% in 10mins of open) iii) LoD was only 40% (i skip trade beyond 60%. I want high possibility of position ending the day with unrealized profit, not near entry price) Entry day is T. 3 stop set based on 33% stop level from entry to LoD. I do not consolidate and adjust my stops to breakeven (avg price) until T+3 days T+3 = 33% size down (immediate partial profit taking or shaving risk down on trade that did not follow through but still hovering above avg entry as I have tight stops (since I only do execution when price action presents entry to LoD below 60%). All stops are consolidated to breakeven level on 1 full singular size. Read more here on my detailed approach to risk management within a singular trade: x.com/jfsrevg/status… 4. Day 4 onwards is all mental stop on 10-MA. I do not mess with the trade if it doesn't close below 10-MA. 5. This trade did not close below 10-MA at all even at 13 x ATR% from 50-MA currently (highest ever). No reason to sell everything, but you have every reason to sell some pieces into strength at extension beyond 10 x ATR% beyond 50-MA. To be fair, nobody will know the outcome on the day their trade execution; but what I strongly advise is to adhere to the principle of law of large number and you need to have this few things right; i) make sure your screener gets u the setup before they MOVE, not after (i do not believe in high volume scan, you have already missed the most optimal entry day and the risk/reward is skewed after it. Try volume based high RVOL 'at time' scan instead during live market at minimum. High volume scan works best only as post continuation base setup, and the perfect entry spot often is a few weeks after that result appear) ii) have a entry rule that stack the odds of position ending the day with unrealized profit. LoD 60% rule, high RVOL etc are my 'secret' iii) ensure you have non-discretionary profit taking/stop loss rule. you cannot second guess the market, and u need to keep your emotion in check. you won't be able to hold a big runner if you like to second guess 'top' and 'bottom' in the market. the trades that can move needle in your annual performance % are trades that you never expect to do what they are doing. they make moves against basic human instinct. iv) you need to know when to go 'heavy' vs 'light' in terms of trade frequency and activity. $KC trade was taken right on the day market bounce off it's rising 50-MA, before subsequent market gap up to reclaim 10 & 20-MA. Market index chart eg. $SPY $RSP $QQQ are great to cushion you when to layer your risk or release the pedal. I will never take on risk when $SPY is 4 x ATR% from 50-MA when it historically pullback from 5 x ATR% from 50-MA. I am pretty certain $KC sort of move will never happen in any stock at this juncture of the market. You need to stack every single possible odds to let the trade work in your favor, and the current market extension now is a headwind more than a tailwind. v) repetition & refine; do this 100 times, go through your trade data and refine. do it another 100 times again, go through your trade data and refine. in a year, you will be able to refine up to 4 times at least. you only can get better if you refine your trading based on your trade journal. you can't escape this part of the work, please. I hope this is helpful, it's just some basic principle, math and plenty of repetition in trading for me. If you find this type of content valuable, do retweet ♾ so I know what sort of things to share in this space during my free time.

$KC - A Breakdown of My Trade on $KC's +180% Move in a Month (Scans, Watchlist Management, Entry Day Insights, and Systematic Risk Management for Holding) Rather than replying to individual DMs about my $KC position (ironically, my earlier post was about $FBTC), I decided it’s better to share this as part of the free educational content for everyone to benefit from. Here are a few key points about the share structure of $KC before the breakout, so you can adjust your screening parameters if needed. This is the type of stock profile that typically shows up in the 'Top 100 Performance% Stocks' annually. It's also why I tend to focus on small to mid-cap stocks most of the time. Share Structure Before Breakout at $3 i) Market Cap: $700M USD (Current: $2B USD) ii) ADR%: 5.7% (Current: 10.8%) iii) IPO Timer: 4.5 Years ago iv) Outstanding Share Float: 250M v) Avg (50) $ Vol: $35M USD/day vi) Avg (50) Share Volume: 4M/day 1. 1st move back above 200-MA after 1 year, +80% with RS during the 2 weeks. $KC will initially show up on your '1-Month Strongest Move' screener. I move the entire list (which includes $KC) to my watchlist, awaiting a higher low swing to confirm a character change. 2. Higher Low may be in place at this point with price contraction within a symmetrical triangle. I abolutely pay more attention to stocks when price contract along with ALL moving averages contracts together. (10, 20, 50, 100, 150, 200 DMA) $KC remains in watchlist, but will begin to keep appearing in my 'Screener within Watchlist' based on technical price compression. 3. Entry day on 5/11; here are some qualification i) it broke out of a 2 week technical triangle pattern and consolidated range ii) it broke out with high RVOL (RVOL was 40% in 10mins of open) iii) LoD was only 40% (i skip trade beyond 60%. I want high possibility of position ending the day with unrealized profit, not near entry price) Entry day is T. 3 stop set based on 33% stop level from entry to LoD. I do not consolidate and adjust my stops to breakeven (avg price) until T+3 days T+3 = 33% size down (immediate partial profit taking or shaving risk down on trade that did not follow through but still hovering above avg entry as I have tight stops (since I only do execution when price action presents entry to LoD below 60%). All stops are consolidated to breakeven level on 1 full singular size. Read more here on my detailed approach to risk management within a singular trade: x.com/jfsrevg/status… 4. Day 4 onwards is all mental stop on 10-MA. I do not mess with the trade if it doesn't close below 10-MA. 5. This trade did not close below 10-MA at all even at 13 x ATR% from 50-MA currently (highest ever). No reason to sell everything, but you have every reason to sell some pieces into strength at extension beyond 10 x ATR% beyond 50-MA. To be fair, nobody will know the outcome on the day their trade execution; but what I strongly advise is to adhere to the principle of law of large number and you need to have this few things right; i) make sure your screener gets u the setup before they MOVE, not after (i do not believe in high volume scan, you have already missed the most optimal entry day and the risk/reward is skewed after it. Try volume based high RVOL 'at time' scan instead during live market at minimum. High volume scan works best only as post continuation base setup, and the perfect entry spot often is a few weeks after that result appear) ii) have a entry rule that stack the odds of position ending the day with unrealized profit. LoD 60% rule, high RVOL etc are my 'secret' iii) ensure you have non-discretionary profit taking/stop loss rule. you cannot second guess the market, and u need to keep your emotion in check. you won't be able to hold a big runner if you like to second guess 'top' and 'bottom' in the market. the trades that can move needle in your annual performance % are trades that you never expect to do what they are doing. they make moves against basic human instinct. iv) you need to know when to go 'heavy' vs 'light' in terms of trade frequency and activity. $KC trade was taken right on the day market bounce off it's rising 50-MA, before subsequent market gap up to reclaim 10 & 20-MA. Market index chart eg. $SPY $RSP $QQQ are great to cushion you when to layer your risk or release the pedal. I will never take on risk when $SPY is 4 x ATR% from 50-MA when it historically pullback from 5 x ATR% from 50-MA. I am pretty certain $KC sort of move will never happen in any stock at this juncture of the market. You need to stack every single possible odds to let the trade work in your favor, and the current market extension now is a headwind more than a tailwind. v) repetition & refine; do this 100 times, go through your trade data and refine. do it another 100 times again, go through your trade data and refine. in a year, you will be able to refine up to 4 times at least. you only can get better if you refine your trading based on your trade journal. you can't escape this part of the work, please. I hope this is helpful, it's just some basic principle, math and plenty of repetition in trading for me. If you find this type of content valuable, do retweet ♾ so I know what sort of things to share in this space during my free time.

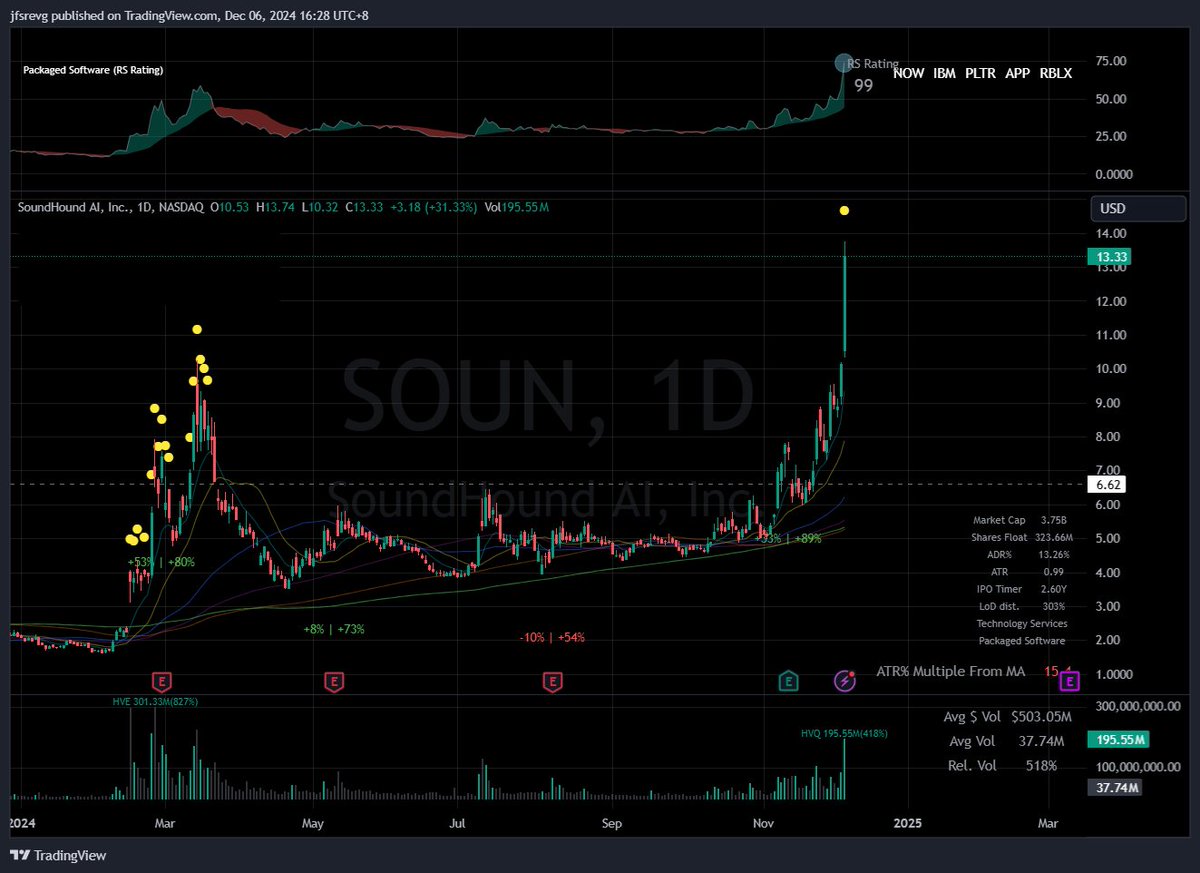
$SOUN , same type of share structure. I taken too many new positions on 21/11 to trade this. such a bad miss.
for anyone curious of how historical ATR% extension from 50-MA works. @wizardjiawei created a great free tool just yesterday that is extremely useful to study charts. tradingview.com/script/KA63V4r…


@jfsrevg Do you still have a limit on share float in screen? The old 1 month strongest stock screen has a limit on float < 50M for stocks smaller than 10B

@jfsrevg Thanks a lot. What's your thoughts on this?


@jfsrevg Phenomenal write up. Greatly appreciate all that you share.


@jfsrevg this content is gold! May I ask where I can read more on your LoD and RVOL entry rules?


@jfsrevg you also may want to check the chart of $QSI

@jfsrevg Incredible trade Jeff. Congrats! Thanks for sharing


@jfsrevg I think this could still go higher - it's above the 200 Weekly moving avg

@jfsrevg Hi Jeff! It´s really appreaciated what you are doing here. Providing learning material how it can be done with this strategy. Thank you! And of course: congrats!


@jfsrevg Impressive! Thanks for sharing, Jeff!

@jfsrevg Thx for the case study. So with such a huge atr / adr % . Does that mean u size down the trade proportionate to the risk per trade rule? Since likelyhood of the expected stop is wider in % terms ? Is it normal to have position sizes that are quite different from each other

@jfsrevg Sorry my complement was too long lol One question to ask - you didn't mention if you have cut size along the way. Do you cut size according to your usual practice? Or you haven't on this stock? If you didn't, why?

@jfsrevg @jfsrevg what if the stock squats below the LoD on the same day you entered the stock? would you be out of the trade on LoD or will keep some ATR% as Stop Loss?

@jfsrevg Mind sharing more about that RS Rating indicator? Is it publicly available (can't find it)?