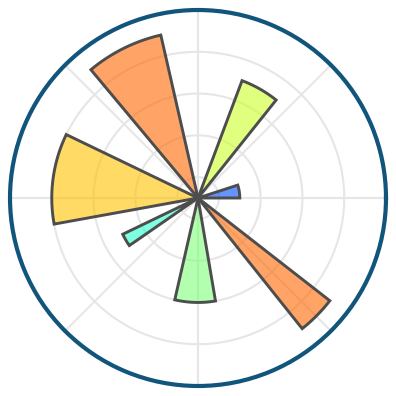
If you're unsure of which method to use for creating subplots, subplot_mosaic is always a good starting point: fig, axd = plt.subplot_mosaic([['point', 'area'], ['line', 'line']])
If you're unsure of which method to use for creating subplots, subplot_mosaic is always a good starting point: fig, axd = plt.subplot_mosaic([['point', 'area'], ['line', 'line']]) https://t.co/1wD8kbe1cU
2
1
22
19K
4
Download Gif
@matplotlib I didn’t understand what this mosaic tell us
@matplotlib Thats great. Please make legends more easy to apply like sketching graphs. Sometimes they are very painful to specialize


