
Cédric Scherer @CedScherer
🧙♂️✨📊 Independent #DataViz Consultant & Designer ♢ PhD in Computational Ecology ♢ #rstats #ggplot2 #figma ♢ #graphics #maps #ddj #design ♢ he/him cedricscherer.com Berlin, Germany Joined March 2015-
Tweets15K
-
Followers26K
-
Following2K
-
Likes26K
The challenge has come to an end. As every year has been intense and inspiring with many wonderful contributions, we thank you for your participation and hope to see you next year! may the #dataviz be with you📈📊📉 #30DayChartChallenge

#30DayChartChallenge | Day 29: Black'n'White (and Day 27: Good/Bad) Mentions of "angel" 👼 and "devil" 👹 across seasons 1-25 of "The Simpsons". I'd love to display the season numbers along the x-axis instead of a color encoding but couldn't make it work. #dataviz #datawrapper


#30DayChartChallenge | Day 19: Dinosaurs Small multiples as a late contribution to day 19. Difficult topic, so I framed "dinosaurs" as characters that had a large contribution to "The Simpsons" early on but started disappearing after the first 10 seasons. #dataviz #datawrapper


#30DayChartChallenge | Day 20: Correlation Catch-up contribution showing the relationship between the number of US views and the number of votes on #IMDb for 27 seasons of "The Simpsons". Special focus on call-outs and tooltip styling. #dataviz #datavisualization #datawrapper


#30DayChartChallenge | Day 22: Mobility Table of words spoken in different vehicles for transportation by land 🚗 🚌, water ⛵, air 🚁, and space 🚀 in 25 seasons of "The Simpsons". #dataviz #datavisualization #simpsons


I am still looking for speakers for Workshops for Ukraine series for summer! If you want to teach a workshop on #RStats, #Python or some other data/research related topic, DM or email [email protected]. Some potential topics in QT, but feel free to suggest other too!
I am still looking for speakers for Workshops for Ukraine series for summer! If you want to teach a workshop on #RStats, #Python or some other data/research related topic, DM or email [email protected]. Some potential topics in QT, but feel free to suggest other too!

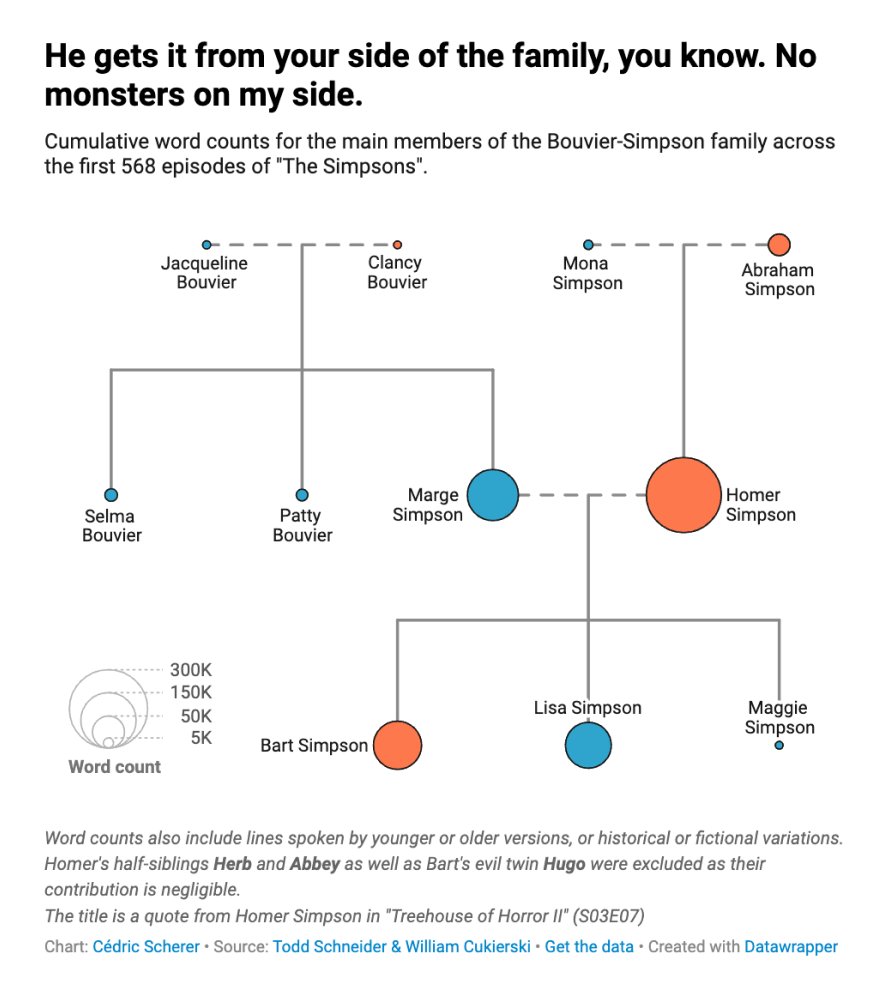
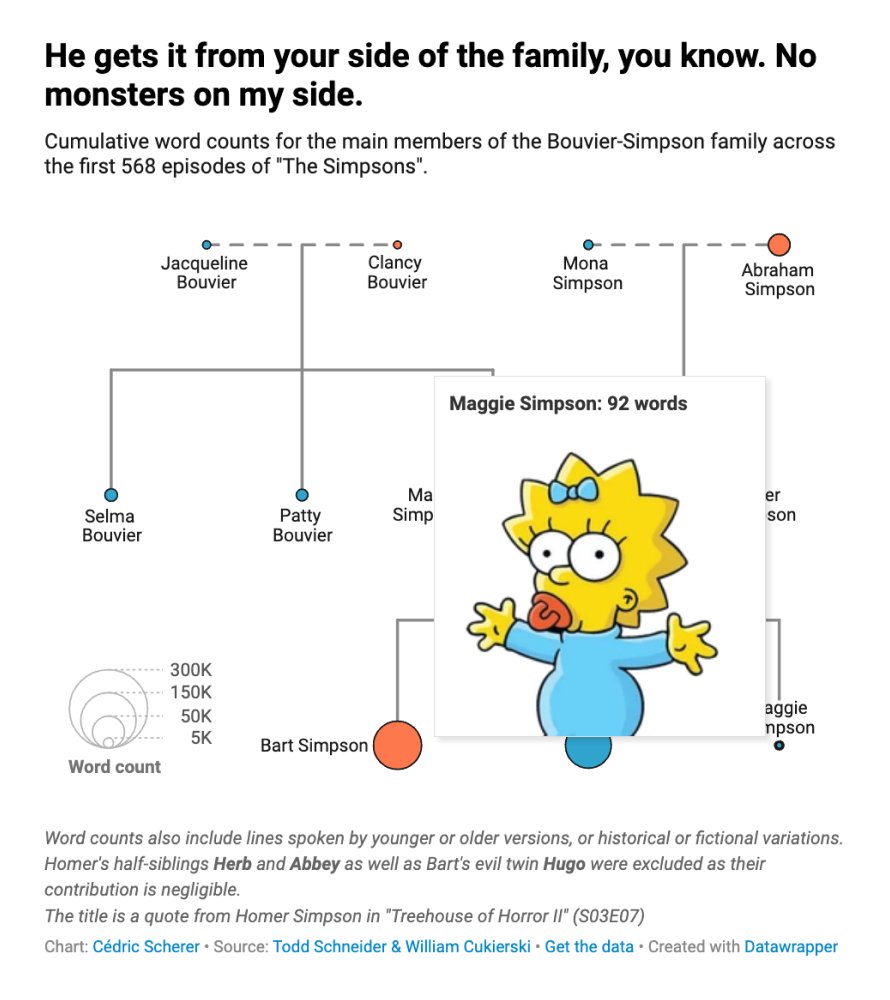
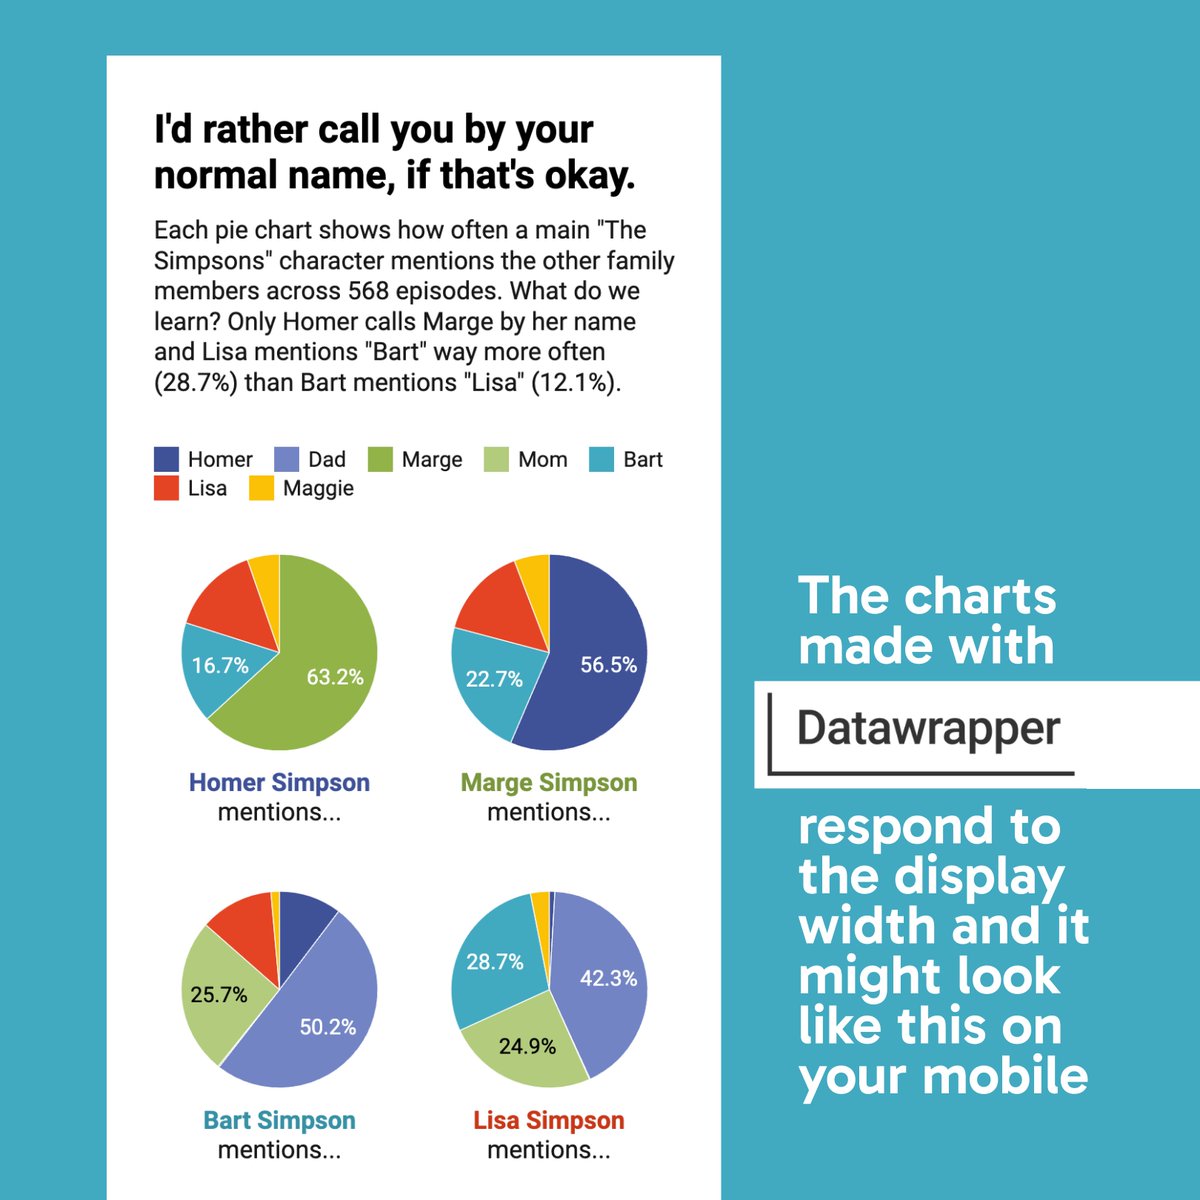
#30DayChartChallenge | Day 13: Family A family tree of "The Simpsons" with word counts for each family member, created with @Datawrapper. #dataviz #datavisualization #family #datawrapper

📊 Tutorial de ggplot2 para crear gráficos increíbles en #Rstats By @CedScherer buff.ly/3FQPqTZ #analytics #datascience #stats #data #dataviz #datavisualization #programming #code #python

#30DayChartChallenge | Alternative Version for Day 11 A set of stacked bars for all members of the "no pie chart gang". Labels above the bars to make it work better on small screens. #dataviz #datavisualization #datawrapper #simpsons

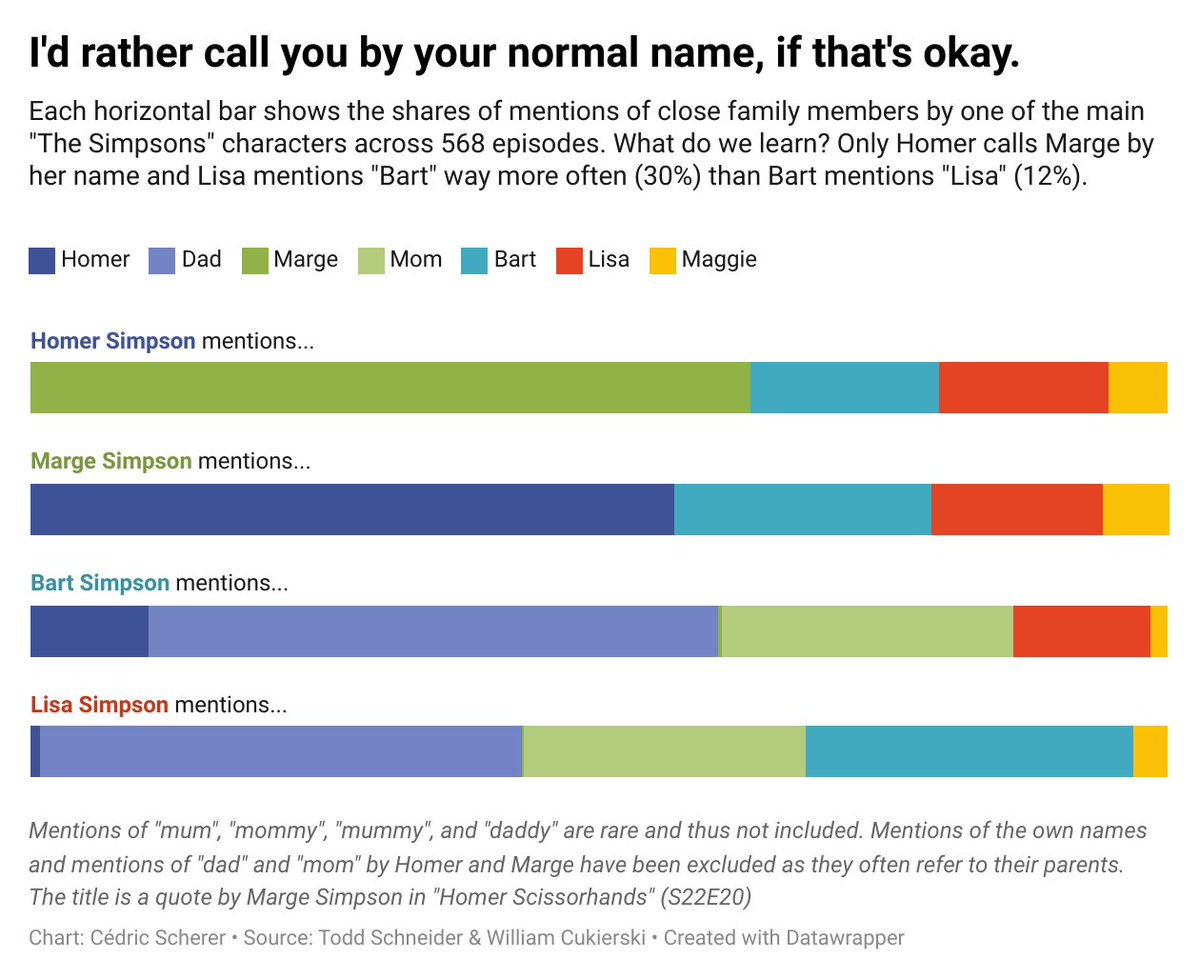
#30DayChartChallenge | Day 11: Mobile-friendly Easy peasy thanks to my tool choice! 💪 Except for the responsive resizing that @Datawrapper charts ship with, I have used a set of pie charts 🧙♀️ that realign and are thus readable even on small displays. #dataviz #simpsons


Albert Rapp @rappa753
13K Followers 134 Following 🎓 Math PhD student & freelancer 👨🏫 Bite-sized insights on dataviz, web dev & data science with R at https://t.co/M34b5BzHTD
R Markdown @rmarkdown
26K Followers 448 Following A community of R Markdown enthusiasts posting anything related to #RStats, especially #RMarkdown, #QuartoPub and #Bookdown.
Yan Holtz @R_Graph_Gallery
19K Followers 724 Following Software engineer who ❤️ #dataviz. Creator of https://t.co/sj29jZPkYr and the R, Python, D3 and React graph galleries. ➡️ https://t.co/PoJNeHXz8a 📈 🌊 🍺
Tom Mock @thomas_mock
19K Followers 2K Following He/Him | Product Manager @posit_pbc👨💻 I ❤️ Data, 🌮, tables, Quarto, #tidyverse & #RStats | @[email protected]
Georgios Karamanis @geokaramanis
8K Followers 266 Following Co-founder and Dataviz designer @__explained, psychiatrist, PhD student
Nadieh Bremer @NadiehBremer
48K Followers 579 Following Data Visualization Artist (+ graduated Astronomer ✨) with a love for Data & Generative Art | 🇳🇱 https://t.co/2QeuXCOGlo
Tyler Morgan-Wall @tylermorganwall
25K Followers 207 Following R, data science, dataviz, maps, raytracing. Developer of rayshader, rayrender, and the rayverse | PhD in Physics | @Penn | tylermorganwall at foss to https://t.co/pBdBFqbrE2
Nicola Rennie | @nren.. @nrennie35
5K Followers 2K Following 💼 Lecturer in Health Data Science at Lancaster University. 💻 #RStats | Python. 🎨 Data visualisation. 🏃♀️ Distance runner. She/her. Views my own.
Alberto Cairo @AlbertoCairo
68K Followers 5K Following For news, follow me on BLUESKY: https://t.co/nN8zwUEmZs and LINKEDIN: https://t.co/BV7fInzN6w
Jon Schwabish @jschwabish
24K Followers 997 Following 📈Economist & DataViz 🕸@urbaninstitute @PolicyViz 🎙PolicyViz Podcast 📺YouTube step-by-step tutorials 🗞On Substack: https://jschwabish.subst 👀All views mine
David Robinson @drob
52K Followers 648 Following Director of Data Science at @Contentsquare. #rstats fan. Dad x2. He/him
Spencer Schien @MrPecners
4K Followers 515 Following I tweet mostly about #RStats and data viz. Salesforce dev and Returned @PeaceCorps Volunteer, too. Data & Analytics for @CityForwardCol (opinions mine)
Kevin Flerlage @FlerlageKev
17K Followers 3K Following Tableau Evangelist/Data Visualization Consultant at Moxy Analytics | 5X Tableau Visionary | 5X Tableau Public Ambassador | One Half of the Flerlage Twins
Wendy Shijia @ShijiaWendy
6K Followers 2K Following Data visualization designer, Tableau Visionary & Tableau Public Ambassador
Lisa Charlotte Muth @lisacmuth
35K Followers 729 Following Formerly @lisacrost. Creating & writing about dataviz for @datawrapper. #visber & @datavisclub organizer. Also over there: @[email protected]
Emil Hvitfeldt @Emil_Hvitfeldt
7K Followers 705 Following Going dark until Twitter is a respectable place again.

David Keyes @dgkeyes
7K Followers 4K Following Helping the rest of us learn #rstats @rfortherest he/him
Cara Thompson @cararthompson
3K Followers 301 Following 👋 #Dataviz Consultant with an academic background 💙 Maximising the impact of other people's expertise
Matthias Stahl 🇪�.. @h_i_g_s_c_h
5K Followers 4K Following Husband & dad^3 ||| head of data & visualizations @derspiegel ||| #Svelte and #D3 ||| computational biology PhD ||| 🇸🇪🇩🇪🇪🇺 ||| opinions my own
Shengbiao Wu @WShengbiao
190 Followers 1K Following Research Assistant Professor| HKU & Urban Environment| Human-Environment Interaction| Associate Editor @HSScomms @FrontRSens| Google Developer Expert (GDE)

Dr. Paras Koundal �.. @paraskoundal
217 Followers 1K Following Astrophysicist 🌌 | Deep Learning🤖| @UDelaware @uw_icecube | Alumni - @KITKarlsruhe @iisermohali | SciComm | Experience - @kek_jp @J_PARC
Jacky @Jacky82446949
6 Followers 461 Following
H. @hferrerr
100 Followers 139 Following

Aaditya Agarwal @not__Aaditya
211 Followers 3K Following Data Science, ML Student and Curious in general.

ClevelandWilm36 @CWilm361286
0 Followers 10 Following
albert @albert0197
93 Followers 1K Following
Keyong @Keyongbio
35 Followers 274 Following PhD Candidate in Department of Clinical Epidemiology, Leiden University Medical Center
Biniv K. Maskay @BinivMaskay
51 Followers 331 Following
Gorety trujillo @gotyte
32 Followers 332 Following
Moti @MotiMathew
0 Followers 29 Following
Mota onNeichtergraff @MotaPeVal
1 Followers 30 Following Who cares, nobody's gonna read this anyways.
Qian He @Carriehe64Qian
95 Followers 505 Following PhD student at UCLA. Interested in climate extremes, drought, wildfire, terrestrial ecosystem, vegetation. Sunset, winter lover.
Sam Wasif @xsamwasif
31 Followers 465 Following
Vijay Jadhav @Vijay__Jadhav
549 Followers 799 Following Media & Communication 🌐 | Information Design 🧮 | Data Visualization 📊 | Digital Media 🖥️ | Passionate about effective communication through design. 🌟

Leonardo Ezequiel @Leyto88lc
1 Followers 36 Following
Victor Eduardo 🥏 @micosapiens711
103 Followers 349 Following Data Analyst | Cuestionador incorregible | Un experto en el arte de los errores | Econ. | 🐵🐺📊🎩
Kiprotich Benard @benardrop16
36 Followers 412 Following Enthuastic Software developer(Frontend). Data Analyst, powerBI developer. HTML5, CSS3, BOOTSTRAP, ReactJS, PHP
abitti awraris @awrarisab_19
49 Followers 3K Following

carbos @crittercarlos
0 Followers 84 Following


VicGrey5Adc @VicGrey5Adc
1 Followers 10 Following
Prashant Sampathkumar @Aarudra1216
2 Followers 89 Following
Marco Hernandez @TmarcoH
5K Followers 1K Following Graphics Editor at @nytgraphics 🇺🇸 || Former @ReutersGraphics 🇸🇬 ı @SCMPgraphics 🇭🇰 ı @nacion 🇨🇷


Jacob Korir @JackKorir
112 Followers 197 Following Food and Nutrition Security Specialist. PhD Candidate, Nutritional Sciences Department, Texas Tech University. Multisectoral Nutrition Governance researcher.
Bobby Gee @bobbygee958
39 Followers 61 Following
nils.witte @niwitte
905 Followers 1K Following Postdoc in Sociology at Federal Institute for Population Research, Germany. Labor Markets, Migration, Citizenship. Views are my own. @[email protected]
André M. Rodrigues @andremrod
83 Followers 439 Following I am an assistant professor at the Institute of Physics -- the University of São Paulo in Brazil. #ScienceEducation #STEMEducation #Vygotsky


Mau Flomo Maiwo @FlomoMau
6 Followers 82 Following
معاذ @madebymouath
71 Followers 131 Following اعمل في #البيانات واشارك بأفضل الممارسات لعرضها 📊 #Business_Intelligence | #DataViz | راسلني اذا محتاج استشارة 📩
Shri Khalpada @ShriKhalpada
277 Followers 177 Following coder, musician, mediocre at chess. working on: creative coding + data viz @ https://t.co/awDO6coObq, NBA analytics @ https://t.co/RkZFosVYhV
Danilo Fiumi @Danilofiumi
85 Followers 612 Following making stuff online https://t.co/SVYhZ4osLK https://t.co/ZboVmzx6SV

Fer Steeb ⭐⭐⭐ @_fstb
136 Followers 525 Following Becario doctoral CONICET | Lic. en Psicología (UBA) | Jurando sin éxito trasladar a tweets mis ocurrencias desde 2010
Tobias Stephan @derterle
18 Followers 181 Following Pangea reunion activist ✊ | stressed and strained researcher | rock and plate tectonics DJ ...sorry for upcoming faults...
@Baraah Queen @QueenBaraah
5 Followers 1K Following I'm available for sex and massage here in #jeddah_massage #riyadh_massage #makkah_massage full body to body massage with oil serious customer should WhatsApp 👇
Ashok Patil @mrashokpatil
32 Followers 440 Following

M. Ali @drmubashirali1
0 Followers 23 Following PhD (CS) Researcher at SIAT, CAS | PPG | Wearable Signal Processing | Noninvasive Blood Glucose Monitor | Diabetes Management
Albert Rapp @rappa753
13K Followers 134 Following 🎓 Math PhD student & freelancer 👨🏫 Bite-sized insights on dataviz, web dev & data science with R at https://t.co/M34b5BzHTD
R Markdown @rmarkdown
26K Followers 448 Following A community of R Markdown enthusiasts posting anything related to #RStats, especially #RMarkdown, #QuartoPub and #Bookdown.
Yan Holtz @R_Graph_Gallery
19K Followers 724 Following Software engineer who ❤️ #dataviz. Creator of https://t.co/sj29jZPkYr and the R, Python, D3 and React graph galleries. ➡️ https://t.co/PoJNeHXz8a 📈 🌊 🍺
We are R-Ladies @WeAreRLadies
34K Followers 192 Following Rotating Curator for the @RLadiesGlobal community #RLadies (currently on a brief break)
Tom Mock @thomas_mock
19K Followers 2K Following He/Him | Product Manager @posit_pbc👨💻 I ❤️ Data, 🌮, tables, Quarto, #tidyverse & #RStats | @[email protected]
Georgios Karamanis @geokaramanis
8K Followers 266 Following Co-founder and Dataviz designer @__explained, psychiatrist, PhD student
Nadieh Bremer @NadiehBremer
48K Followers 579 Following Data Visualization Artist (+ graduated Astronomer ✨) with a love for Data & Generative Art | 🇳🇱 https://t.co/2QeuXCOGlo
Federica Fragapane @fedfragapane
20K Followers 1K Following Information designer based in Italy. Works in the Permanent Collection of MoMA 🔗 https://t.co/ggpM8XORDO
Tyler Morgan-Wall @tylermorganwall
25K Followers 207 Following R, data science, dataviz, maps, raytracing. Developer of rayshader, rayrender, and the rayverse | PhD in Physics | @Penn | tylermorganwall at foss to https://t.co/pBdBFqbrE2
Nicola Rennie | @nren.. @nrennie35
5K Followers 2K Following 💼 Lecturer in Health Data Science at Lancaster University. 💻 #RStats | Python. 🎨 Data visualisation. 🏃♀️ Distance runner. She/her. Views my own.
Alberto Cairo @AlbertoCairo
68K Followers 5K Following For news, follow me on BLUESKY: https://t.co/nN8zwUEmZs and LINKEDIN: https://t.co/BV7fInzN6w
R for the Rest of Us @rfortherest
25K Followers 219 Following You don’t need a PhD in statistics or years of coding experience to learn R, the most powerful tool for data analysis and visualization. Made by @dgkeyes.
Jakub Nowosad @jakub_nowosad
9K Followers 192 Following 🌐 Computational geographer. Assistant Professor at @UAM_Poznan. Co-author of https://t.co/5wDJ4L9v9V, https://t.co/SWQyjrJlN6, and https://t.co/06dwTiUgxz books.
Jon Schwabish @jschwabish
24K Followers 997 Following 📈Economist & DataViz 🕸@urbaninstitute @PolicyViz 🎙PolicyViz Podcast 📺YouTube step-by-step tutorials 🗞On Substack: https://jschwabish.subst 👀All views mine
David Robinson @drob
52K Followers 648 Following Director of Data Science at @Contentsquare. #rstats fan. Dad x2. He/him
Jenny Bryan @JennyBryan
36K Followers 640 Following Software engineer @posit_pbc, humane #rstats Trying the mastodon thing at: @[email protected] Also at: @jennybryan.bsky.social
Kevin Flerlage @FlerlageKev
17K Followers 3K Following Tableau Evangelist/Data Visualization Consultant at Moxy Analytics | 5X Tableau Visionary | 5X Tableau Public Ambassador | One Half of the Flerlage Twins
Wendy Shijia @ShijiaWendy
6K Followers 2K Following Data visualization designer, Tableau Visionary & Tableau Public Ambassador
Margarida Esteves @MargaridaEstevs
99 Followers 47 Following Illustrator. Loves to draw little houses, landscapes and maps! ✨ Rep by @_Bright_Agency
Ren Yuan @_renyuan
2K Followers 56 Following Artist • Designer • Programmer - Generative Art | Computer Graphics | Machine Learning


Joseph Ricafort @josephricafort
721 Followers 705 Following See & Explore SE Asia Through Data | Digigraphics Designer for The Straits Times' Interactives (visual opinions are mine)
mattytwoshoes @mattytwoshoes
359 Followers 455 Following Decision Science for Analysts 📈 Come learn to make better data-informed decisions with me live 👉 https://t.co/WOIEIUlBR5

Richard Bamattre - @b.. @rbamattre
669 Followers 621 Following Local government data science lead. Not so recent PhD. Data viz, machine learning & data for social good. Tweets my own.
Nikos Pechlivanis @npechl
385 Followers 358 Following Bioinformatics & Data Visualization @INAB_Institute / @CERTHellas #Bioinformatics #RStats #dataviz
Fil @recifs
3K Followers 3K Following Vocateur. Data, maps & journalism https://t.co/Rkqi2Ij05j https://t.co/DgCttMivWc @[email protected] https://t.co/AqaM3OPtgr
Chris Henrick | @clhe.. @chrislhenrick
1K Followers 1K Following Software dev at @esri; prev @Google, @GreenInfo, @Stamen; Alum @MFADT; social justice, FOSS, GIS, percussion, cycling. he/him https://t.co/MDfFuV3li2
Miguel Mahecha @MiguelDMahecha
2K Followers 2K Following Earth system data sciences Prof. @UniLeipzig @RSC4Earth @UFZ_de, @iDiv, worried about climate extremes, biodiv. & the 🌎's future, editor @EnvDataScience
ESA Climate Office @esaclimate
12K Followers 479 Following European Space Agency's Climate Office, often tweeting about ESA's Climate Change Initiative programme
Jana Tauschinski @janatausch
795 Followers 814 Following graphics editor @FT | prev @BBCNews @the_young_fdn | data viz @LCCLondon
Nicki Camberg @nickicamberg
1K Followers 2K Following lead data journalist @chartmetric | formerly @AxiosVisuals, @CNNdatagraphics, @COVID19Tracking | @BarnardCollege grad | live graph love | she/they
Rocío Márquez @arixha
1K Followers 2K Following Infographics @SCMPgraphics | Previous @elconfidencial @ec_diseno | Data + design + code = 🐱 | Feminista y animalista ✊
Saloni @salonium
29K Followers 2K Following Thinking & writing about science. Research @OurWorldInData. Co-founder @WorksInProgMag. 🇭🇰🇮🇳🏳️🌈
Carlos Hernandez @carlitos_m_h
3K Followers 3K Following Ingeniero Agronómo UNRC 🇦🇷 - Ms Student KSU 🇺🇲 Digital Farming Systems 🌱 👩💻🌎 🛰️
Catharina Neumann @Neumann_Ca
103 Followers 388 Following PhD student @FU_Berlin @mrillig lab @bio_move / movement behavior of filamentous fungi / x is a collective notebook, connect the dots
The {gt}/great_tables.. @gt_package
3K Followers 3K Following Table generation packages for R and Python. Helping you make beautiful tables since 2018. Join our wonderful Discord at https://t.co/QImzxY4SM8
ShinyConf @ShinyConf
1K Followers 915 Following The Annual #ShinyConf, powered by @Appsilon 💙 Step into the world where the #futureisshiny! 🗓️ Save the dates: April 17-19
Rachael Dempsey ...@r.. @_RachaelDempsey
3K Followers 2K Following Host of the Data Science Hangout: https://t.co/cuVraBiACb Random things that make me happy: live music, cats, snowboarding, making pretty cheese boards
Tesla DuBois @TeslaDu.. @TeslaDuBois
491 Followers 571 Following @[email protected] Perpetual learner | #Rstats | #GIS | Lecturer, student, researcher, mom |
Ciera Martinez, PhD @CieraReports
1K Followers 1K Following Senior Program Manager at Schmidt Center for Data Science and Environment UC Berkeley Open Research, Software, and Community she/her
FatBear @FatBear_bio
99 Followers 1 Following FatBear wildlife science solutions Data analyses and capacity building in animal movement, habitat selection and connectivity modeling
zedela @zedelaberlin
5 Followers 1 Following
Jasmin Sarah König @jasminskoenig
302 Followers 702 Following Doctoral Researcher @uhh, former guest @DukePoliSci, studies populists, courts & their interactions. Loves #dataviz, #rstats & #ggplot. Private account, her/she
Sonja Peteranderl (ev.. @glocalreporting
5K Followers 1K Following Crime/OC/Tech/Future. Founder BuzzingCities Lab, OpenCrime, School of Conflict&Peace. Check reports @DerSPIEGEL SWR Vollbild @WIRED. AI Fellow @algorithmwatch
Galselo Wrapsy @galselo
580 Followers 698 Following Ci piacciono i grafici. Dashboard clima https://t.co/wuslEbVm8U Cover image @tomgauld
Duncan Bradley @duncanbradley_
127 Followers 136 Following PhD Psychology at @OfficialUoM. Researching how we understand information in data visualisations 📊 Also interested in open research and #rstats. he/him
Nahel Belgherze @WxNB_
51K Followers 2K Following Covering extreme weather events around the world. Also interested in climate dynamics, geohazards & satellite remote sensing. Views are my own.
David Spratt @djspratt
9K Followers 3K Following Research Director, Breakthrough National Centre for Climate Restoration. https://t.co/xrB8PG7KJQ. Personal tweets. Blog: https://t.co/x1WZANJEcZ
Loris Mat @lorismat_
283 Followers 217 Following Freelancing in #dataviz & #webdesign #creativecoding otherwise 🖋️🎨 💻 in #threejs #glsl #d3js mostly
Explained @__explained
240 Followers 7 Following We turn your complex data into charts, maps, visuals and data stories. Contact us if you want to use our visuals or collaborate with us: [email protected]
Doug Dowson @doug_dowson
974 Followers 595 Following Data journalist at @TheEconomist covering business and economics. Past: @USTreasury @PIIE @CenterOnBudget


AfricaInNumbers @AfricanNumbers
131 Followers 136 Following Explaining a misunderstood continent using open source data 🌍📊
Genuine Impact @genuine_impact
16K Followers 36 Following You're only seeing 5% of the charts we do. Check out all of them in our newsletter 👇
Winifred @MissAmase
868 Followers 365 Following Data visualization designer | Freelance Data Journalist @coingecko | I turn my curiosity to visual stories
Arijit Gupta @Arijitdesignsit
59 Followers 115 Following Kabhi Data, Kabhi Design! (Sometimes Data, Sometimes Design!)


Marco Sciaini @shinysci
1K Followers 1K Following 🗺️ | 📈 | 🔍 | 🐶 | 🛰️ | 🍜 | ☕ | Freelance Developer and Analyst

Mihály Minkó @nezach
211 Followers 227 Following Data visualization evangelist, teacher and hobbyst.
Federica Gazzelloni®.. @FGazzelloni
3K Followers 5K Following @IHME_UW |@R4DScommunity |@RLadiesRome |@Bioconductor |@TheCarpentries 🔗GitHub: https://t.co/G5ROFUJv57 🔗YouTube: @federicagazzelloni
DEEPSHA MENGHANI @bigdatadipper
453 Followers 488 Following Data Scientist at Microsoft #RStats #QuartoPub #DataViz … Opinions are my own. Pronouns - she/her
Received an email inviting me to participate in an Instagram "takeover". Lads, I can barely be arsed to take over my own Instagram account most of the time let alone someone else's.
💥 Acaba de finalizar el #30DayChartChallenge y este año @CedScherer ha creado #dataviz interactivos y responsive con DataWrapper, sin código, con datos de Los Simpson. Dale un vistazo a los mejores gráficos en el siguiente link! buff.ly/4bk2TDT #rstats #python #stats


Und so sieht es für den Trend zwischen AfD und Grüne aus. Klar ist da ein Trend. Aber da ist auch wieder Überlappung und viel Unsicherheit im Mean.

@sewenz @DanBischof @juliustroeger ja, das würde mich jetzt schon näher interessieren (gerne ohne weitere Fäkalsprache)

@CedScherer @Datawrapper Great work, as always. As with R and ggplot2, I'm sure your charts will inspire @Datawrapper users, too. 👏

Day 30!! | #30DayChartChallenge | FiveThirtyEight Theme Day 📊: public.tableau.com/app/profile/br…

Japan’s GDP and unemployment rate from 2000 to 2022. Animated connected scatterplot, created with Flourish. Interactive version: public.flourish.studio/visualisation/… #30DayChartChallenge | #Day18 | Data Day: Asian Development Bank #flourish 📊
How many points does it take to win the title in the Bundesliga? ⚽ A chart in the style of FiveThirtyEight. ✨ And that's it for the #30DayChartChallenge 2024. 🙌 #30DayChartChallenge | #Day30 | Theme Day: FiveThirtyEight #rstats 📊 #ggplot2


Missed the #30DayChartChallenge, but I have something to share #Day9 #MajorMinor


#30DayChartChallenge | Day 05 - Diverging Comparison of the distribution of population in Slovakia in 1946 and 2022 (the oldest and the most recent data I could get). Data source: Statistical Office of the Slovak Republic Tool used: #excel, #inkscape


It's a wrappp!! So happy I completed 30 new charts, exploring new data, viz, chart capabilities especially using #Tableau. Definitely will join next year's challenge. I'm compiling all of my #30DayChartChallenge in a single thread. public.tableau.com/app/profile/di…


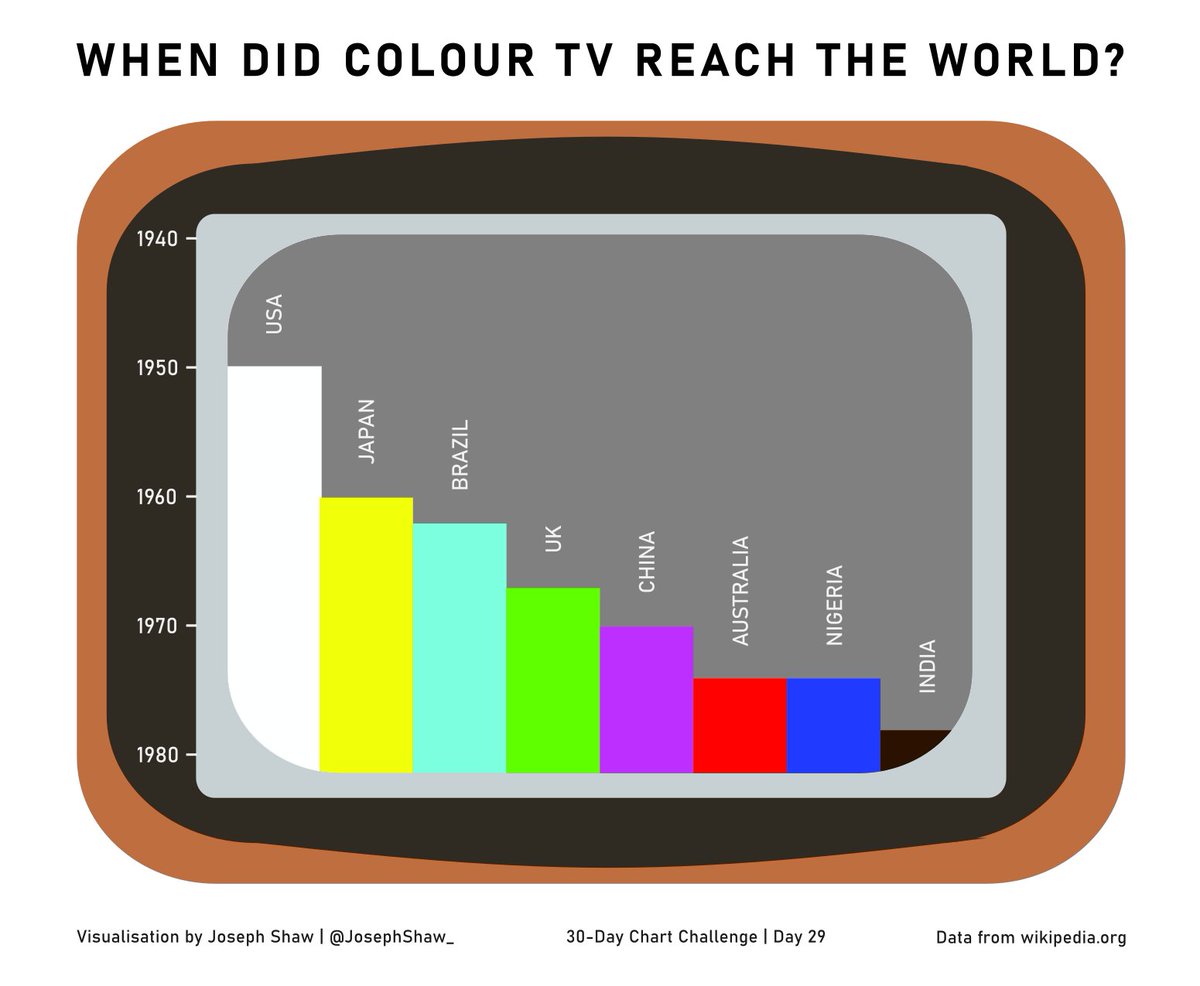
Day 29 of the #30DayChartChallenge - Black and White: When did colour TV reach the world?
#30DayChartChallenge | Day 06 - OECD data This chart shows the share of the mother language in education (pupils 6-14 years of age). I also created a cool animated bar chart race: public.flourish.studio/visualisation/… Data source: OECD Tool used: #Flourish

Day 30 of the #30DayChartChallenge - FiveThirtyEight: Comparing Premier League-winning managers


#30DayChartChallenge | Day 27: good/bad Based on 4 systematic reviews and meta-analyses of observational data (largest ~850,000 people) Vegetarian diets are associated with a slightly reduced risk of heart diseases. But neither diet is “good” or “bad”. Heart diseases may occur…


No British political party had more than 21 women seated concurrently in parliament until the mid 1980s, and only one (Labour) had more than 40 before the Millennium. #Day30 FiveThirtyEight theme day #30DayChartChallenge

Day 27 & 28: Good/Bad & Trend of #30DayChartChallenge Catching up with the remaining 4 charts, here are the #trends of #fdi's/#investments categorized between #ASEAN #industries. Good to know which #sectors you'll have confidence to #invest #longterm.

The #30DayChartChallenge is over! It was a lot of fun and more creatively challenging than I thought. I put together a little gallery of my work and wrote a bit about my experience doing it here: perthirtysix.com/essay/30-day-c…

The challenge has come to an end. As every year has been intense and inspiring with many wonderful contributions, we thank you for your participation and hope to see you next year! may the #dataviz be with you📈📊📉 #30DayChartChallenge

#LATAM | ✨ ¡Despidamos #abril por todo lo alto! ✨ 🤓📊 Para cerrar el #30DayChartChallenge... 🎆 ¡Practica, difunde y muestra tus habilidades dateras! 🎆 💻📈 Checa The Python Graph Gallery y transforma tus #datos en visualizaciones ACÁ ➡️ bit.ly/4dyx64f

Trends for United States
You might like