Drew Tandy @DrewDrawsData
Exploring data visualization, searching for meaning and beauty along the way. PsychGraphs.com San Diego, CA Joined March 2023-
Tweets54
-
Followers18
-
Following205
-
Likes60
1)I’m not the only one! 2) Jim Harbaugh might have a redeeming quality? 🤯 instagram.com/reel/CzhSQ1qJZ…

R is getting better in Production!! I've just added to my cheat sheet: ✅ Production: plumber, targets, renv ✅ EDA: DataExplorer, skimr, correlationfunnel ✅ ML & DL: Torch for R, mlverse Get the updated R cheat sheet here: buff.ly/3FBUGgK

My Google sheets bell curve graph for standardized scores is starting to look like something!

It felt almost magical to read this at the exact moment I was going through the same thing.

It felt almost magical to read this at the exact moment I was going through the same thing.
Note to self: next time you’re stuck on a coding problem, sleep on it and come back to it in the morning.
Speaking of dabbling, I do a little bit of TV repair every few years thanks to YouTube SMEs, nbd.

This one goes out to the dabblers, the explorers, and the birds uncomfortable in the coziest of cages. Thank you @DavidEpstein for the book I look forward to reading (Range), and @satyx for the podcast I look forward to exploring (#DataRadicals). open.spotify.com/episode/2CerQ5…
Geospatial relative proportions of deutoplasm, albumen, cinnamomum verum, vanillic aldehyde, and vaccas lac (aka French Toast) #dataviz

Hmm, this has me thinking about where the dashboards I am developing would benefit from narrative.
So @ProcessingOrg is pretty fun. Lets see where this takes us. #processing #dataart #genart


You can't innovate when you're always taking the most efficient route. 🎲✨📈 Listen to the full episode here: dataviztoday.com/shownotes/84
Realized today that using a Mac is a barrier to exploring two of the tools I am most interested in: Power Query and PowerBI 👎 Also, found some #dataviz inspiration in the backyard:


📈Big new data release today on #CensusMaps!📉 See how your area has changed over the past 10 years, right down to a neighbourhood level ons.gov.uk/census/maps 1/3


Learn 12 ways data distributions can be visualized in this Back to Viz Basics #B2VB entry #VizOfTheDay by @KevinWee90—including box plots, histograms, beeswarm plots, and more. To learn more about each chart, click the expand icon on each card. tabsoft.co/3L3zMLf


Rock Dick @sulak_jenn77249
4 Followers 127 Following I am a stock analyst who provides a free stock recommendation every day. For more stock updates, please follow me. Thanks.


MayGoldsmith @ZZ6qtjx0WiCdk
67 Followers 7K Following
Drarthoy @DrarthoyMn556
113 Followers 4K Following
Dion @nizukayume77164
77 Followers 7K Following
Wendy @tosarika135817
29 Followers 2K Following
Matilda @p_matilda94
270 Followers 3K Following

Noelle @noelle_battle20
317 Followers 3K Following
Letisha @s_letisha27
297 Followers 3K Following
Kevin Flerlage @FlerlageKev
17K Followers 3K Following Tableau Evangelist/Data Visualization Consultant at Moxy Analytics | Hall of Fame Tableau Visionary | 6X Tableau Public Ambassador | Half of the Flerlage Twins
Charlie Verdel @CSVerdel
3K Followers 4K Following Geologist in central Australia. 🇺🇸 in 🇦🇺 https://t.co/fvuMPMPayp
Marsja.se @MarsjaSe
697 Followers 1K Following Blogging about #Python and #RStats. Interested in data analysis, data visualization, among other things. Join the Telegram channel: https://t.co/vrbd6320QK
Ryan Estrellado @ry_estrellado
883 Followers 253 Following Author and educator. Views are my own. The K–12 Educator's Data Guidebook. Sign up for K–12 educator resources on my site.
Cara Jackson @carajac... @cara__jackson
10K Followers 6K Following
Processing @ProcessingOrg
36K Followers 395 Following We cultivate creative code and communities to empower learners, coders, and artists to shape equitable digital futures.
Tim Wilson @tgwilson
7K Followers 2K Following Part-time wit. Full-time curmudgeon. Co-host: @analyticshour. Head of Solutions: @less_and_better. Views expressed here are mine & often cranky.
Market Clubhouse @MarketClubhouse
3K Followers 1 Following Exclusive Members Only Trading Community. Market Clubhouse offers Daily Live Trading with Screenshare @ 8AM EST, The Morning Memo, Live Webinars, and Much More!
RIPS @SellingRips
35K Followers 122 Following 📈 Full-time Pro Trader 📊 Empowering Traders in Equities, Options, and Futures ⭐ Join Me Trading LIVE Every Day in @MarketClubhouse 💹🏡
Planet @planet
255K Followers 4K Following We see things from a different angle. 🛰️🕊️ Public Benefit Corporation on NYSE $PL
Mr. Collins, Sunnysid... @11MrCollins11
714 Followers 547 Following Classroom Teacher, Music Teacher, Lifelong Learner
Ellie Balk @elliebalk
306 Followers 366 Following Math and Data Based Mural Artist, Organizer, Project Creator, Educator
Vidya Setlur @vsetlur
2K Followers 568 Following Head of Tableau Research and Wiley book author - NLP, visual analytics, enjoys the sun, tech, farmers' markets, and coffee. Opinions are my own.
Natalie Schaworonkow @nschawor
5K Followers 905 Following investigating electric waves in the brain, thinking about visualization, interfaces, art & beauty with computers. new home ▶️ https://t.co/x4ZAZejVIA
Luiz Pessoa @PessoaBrain
45K Followers 1K Following Neuroscientist interested in cognitive-emotional brain Author of The Entangled Brain (MIT Press); The Cogitive-Emotional Brain Neuroscience & Philosophy Salon
Sapien Labs @sapien_labs
1K Followers 581 Following An #opendata platform for understanding the spectrum of dynamical properties of the human #brain across global populations #Neurotech #MentalHealth #diversity
DataCamp @DataCamp
106K Followers 471 Following Learn data and AI skills from scratch with 500+ courses. Master Python, ChatGPT, SQL, Power BI, and more.
Jeffrey Shaffer @DataPlusScience
35K Followers 2K Following Director Applied AI Lab & Perry Professor at UC, Author, Podcaster, Tableau Visionary Hall of Fame https://t.co/hOwQg4AtRS●https://t.co/Z8JTLTF9Uj●https://t.co/XYIW0lre98

Analytics Power Hour @AnalyticsHour
3K Followers 3K Following The podcast where @tgwilson, @mymo, @moemkiss, @valkroll, & @JulieMHoyer discuss the analytics issues of the day, with producing by @joshcrowhurst
Mathew Green @mathewogreen
1K Followers 3K Following I have the best job in the world. Public Education. ✏️ Proud AP 🎙 https://t.co/M2vqlhLZtf @penconference. Opinions are all mine.
Dr Kareem Carr, Stati... @kareem_carr
172K Followers 350 Following Statistician. PhD @Harvard • Follow me for fun, nerdy content • Author of the Vital Statistics newsletter (link in bio)
AEFP @aefpweb
4K Followers 389 Following Association for Education Finance and Policy (AEFP), a non-profit academic and professional organization.
Andy Cotgreave @acotgreave
17K Followers 1K Following Find me on my newsletter https://t.co/OMuuEiRcbB Or on LinkedIn
Mike Bostock @mbostock
61K Followers 9 Following Visualization toolmaker. Founder @observablehq. Creator @d3js_org. Former @nytgraphics. Pronounced BOSS-tock.
David Epstein @DavidEpstein
57K Followers 1K Following author RANGE and TheSportsGene. Ex-@ProPublica, @SInow. (pic is w/Frances Hesselbein). IG @davidepstein. RANGE WIDELY newsletter 👉 https://t.co/jIJNey9epd
Alation @Alation
4K Followers 2K Following Alation is the #DataIntelligence company 💡 We empower organizations to realize value from every data and AI initiative 🧡
Satyen Sangani @satyx
951 Followers 246 Following Husband, Dad, Son, Friend, Introverted CEO, Founder @Alation, host of #DataRadicals podcast
Asmae Toumi @asmae_toumi
11K Followers 515 Following data and analytics • #rstats • Contact: [email protected]
David Eads @eads
5K Followers 4K Following Data editor @MarshallProj. Founder @invinst. Taking an extended break from social media. (he/him)
Explained @__explained
276 Followers 7 Following We turn complex data into charts, maps, visuals and data stories. Contact us if you want to use our visuals or collaborate with us: [email protected]
Information is Beauti... @infobeautiful
119K Followers 456 Following Data-visualizations & infographics made by David McCandless @mccandelish - app @vizsweet - new project @beautiful__news - https://t.co/oVLj2XZ7nf
TidyTuesday Podcast @tidypod
8K Followers 560 Following A short weekly #rstats podcast about cleaning and visualizing #tidytuesday data. A project of the @R4DScommunity, hosted by @jonthegeek. #dataviz for your ears.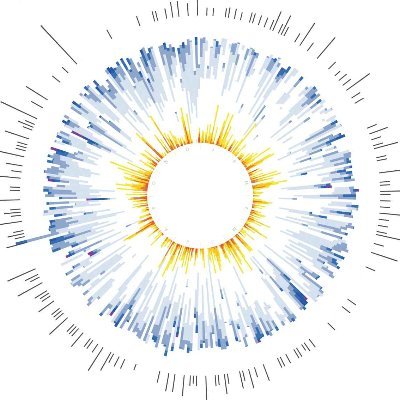
Tidy Tuesday Bot @TidyTuesday_Bot
3K Followers 3 Following Twitter Bot for Promoting #TidyTuesday Visualizations. Follow to get started. Made by @harshbg
Amy Wu @vizsmart
2K Followers 850 Following Co-Lead, #EduVizzers | Tableau Ambassador | 2 x #VizOfTheDay | #Vizzie Nominee | Co-Lead, Boston #TUG | Views are my own
@AlSweigart@mastodon.... @AlSweigart
27K Followers 1K Following Author of "Automate the Boring Stuff with Python" and other programming books. This account is just promo stuff now, follow me on Mastodon. he/him

Aaron Colby Williams @aboutaaron
7K Followers 2K Following I’m off twitter—email me (check website) ▫️ staff viz engineer @netflix ▫️ ex-data reporter @washingtonpost ▫️ board member @newsproduct
Michael Lopez @StatsbyLopez
28K Followers 681 Following Data & Analytics @NFL, with stops at Skidmore (Asst Prof), Brown (PhD), UMass (MS), and Bates (Math, 🏈)
The DataFace @TheDataFace
1K Followers 903 Following A digital agency, specializing in data viz. || email: [email protected]
OutlierConf @OutlierConf
4K Followers 570 Following This account is inactive. Follow @DataVizSociety for Outlier Conference updates.
National Integrated H... @HeatGov
2K Followers 87 Following The National Integrated Heat Health Information System (NIHHIS). Follow us for information, tools, and resources on heat and health #NIHHIS #HeatSafety @NOAA
Melanie Mitchell @MelMitchell1
48K Followers 672 Following Professor, Santa Fe Institute. Mostly posting on https://t.co/4NpA2IL5Va (at-melaniemitchell). More thoughts at https://t.co/nC43NHRozX.
Complexity Digest @cxdig
22K Followers 2K Following @cssociety.bsky.social Networking the complexity community since 1999. Official news channel of the Complex Systems Society @CompSysSoc. Edited by @cgershen.
Scott Page @Scott_E_Page
8K Followers 588 Following Scott Page is the John Seely Brown Distinguished University Professor at the University of Michigan and an external faculty member of the Santa Fe Institute.
DataSuperStar @DataSuperStar
243 Followers 454 Following Data visualisation enthusiasts ! Submit your BUSINESS DASHBOARD The winner gets $200. #DataSuperStar Made by @saveriorocc and @VizWithIrene
Jane Clark @JaneClark06
136 Followers 411 Following Associate Director @eddatacampaign advocating for #eddata. Tweets are my own.
Rachel Anderson @rachelbarrer7
1K Followers 1K Following A vice president at the Data Quality Campaign with a focus on policy and research. An advocate for education & #eddata! https://t.co/n1zP1B6uTU
EdDataCA @EdDataCA
234 Followers 199 Following Timely and comprehensive data about California's public K-12 schools and districts presented in context.
Data Quality Campaign @EdDataCampaign
10K Followers 881 Following We advocate to change the role of data to ensure that data works for everyone navigating their education and workforce journeys. @dqcdata.bsky.social
Katharine Strunk @KatharineStrunk
4K Followers 968 Following Dean and George and Diane Weiss Professor of Education @PennGSE. Mom of 2 amazing boys. Runner, nature lover, and lifelong learner.
Nikki Siapno @NikkiSiapno
169K Followers 310 Following Engineering Manager at @Canva | Co-Founder of Level Up Coding
San Diego Data @sandiegodata
286 Followers 143 Following Startup nonprofit providing data and analysis for civic and social groups.
T&F Education Researc... @tandfeducation
12K Followers 2K Following Connecting you to the latest global education research, news and offers.
The Aletheia Society @spedaccelerator
267 Followers 26 Following Democratizing special education research to improve teaching & learning. Home of the Special Education Research Accelerator
Journal of Internatio... @jistudents
3K Followers 1K Following a flagship peer-reviewed publication on international educationTrends for United States
You might like