Search results for #Plotly

Altair, Plotly y Bokeh son tres librerías cuyo su uso puede ser muy útil en ciertos escenarios: 🔹 #Altair es una opción para casos de uso muy simples 🔹 #Plotly permite representar conjuntos de datos pequeños o medianos con pocas transformaciones #DataAnalytics #Python

¡Sumérgete en el emocionante mundo de la visualización de datos en Python en esta sesión de dos horas! 📊 ¡No te lo pierdas! Regístrate aquí: forms.office.com/r/mEGvfFxwdD 🚀 #Python #VisualizaciónDeDatos #Matplotlib #Seaborn #Plotly


Many thanks to @plotlygraphs for the idea, support and proofreading 🩵 FIN 🙃 #python #plotly #DASH

_/_/_/_/_/ ٩(ˊᗜˋ*)و #CodingLog #Plotly のレジェンドグルーピングは個別に表示非表示切り替えできんやん。むう。

A Simple Guide to Plotly for Plotting Financial Chart #Python #Plotly #Stock #Stocktrading plainenglish.io/blog/a-simple-…
See what we've been up to with this month’s newsletter! 🌷 April brought tons of #Datascience events, community highlights, and new resources at Plotly: • Watch highlights from our webinar with @SPGlobal Market Intelligence • Check out where the #Plotly team has been with…


which can be seen at the end of this thread. This lesson reviewed: - investigation of NaN values - object conversion to numbers - donut charts with #plotly - smoothing time series data with rolling average - grouping, merging, sorting, and aggregation methods

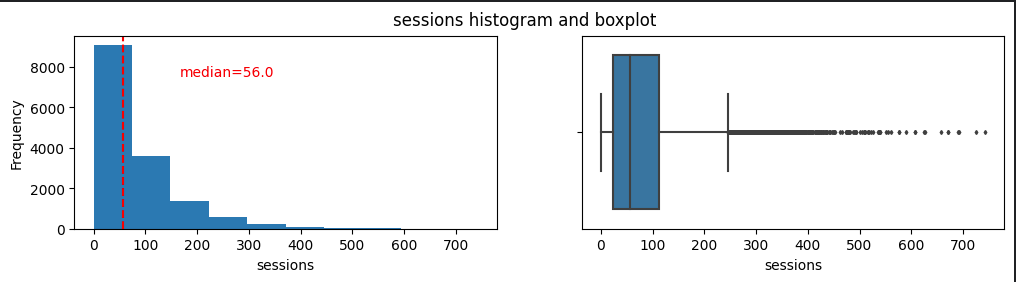
plotly.expressの各種関数のmarginal_x,yオプションで、横と縦にヒストグラムや箱ひげ図などを併せて描画できます。 分布の違いがより分かりやすくなると思います💡 公式ドキュメント plotly.com/python/margina… #python #plotly


変わった形式のデータをPlotlyで可視化するというトライをしました。 可視化はJavaScriptのライブラリがいろいろありますが、 直に扱うのが難しいデータもあるのでそういう時はPythonを経由するとやりやすいですね。 #qiita #python #plotly qiita.com/satoshi256kbyt…
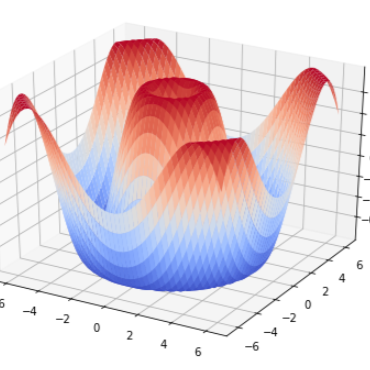
#三次元 #サーフェスプロット #Plotly #Python 「三次元のサーフェスプロット (Plotly)」という記事を書いてみました。 ailogsite.netlify.app/2024/04/28/202…

Analytics Project of the week: Analyzing Driving App Usage. Used #numpy, #pandas, #matplotlib, #plotly and #seaborn, to EDA driven app usage to enhance data-backed decisions on future app enhancements. Pls follow on kaggle and give and upvote. kaggle.com/code/kwabenaad…


#Nba has 30 teams and each team's market is different. I used publicly available listing data from a major ticket exchange to create this #plotly #joyplot that shows the price distribution by team for 2021-2022 season. Anything surprises you? @plotlygraphs @NBA


Plotly @plotlygraphs
43K Followers 9K Following The low-code framework for rapidly building interactive, scalable data apps in Python.

plotly.js @plotly_js
336 Followers 0 Following This account is no longer maintained. Please see @plotlygraphs for updated posts.
PlotlyDashVisualizati.. @PlotlyDashVis
75 Followers 2 Following Experimenting with using Plotly Dash creatively. Follow on youtube: https://t.co/X7sa0LWNgT…
Elias Dabbas @eliasdabbas
3K Followers 0 Following Digital Marketing meets Data Science → #advertools Author: Interactive Dashboards & Data Apps with Plotly & Dash
plotly.eth @plotlyeth
9 Followers 8 Following
Plotly Québec @PlotlyQC
6 Followers 2 Following Un framework nécessitant que peu de code pour créer rapidement des applications de données interactives et évolutives en Python.

Chris P @chriddyp
464 Followers 104 Following montréalais, cofounder of Plotly, author of Dash. 📣 June Dash Workshop in DC!https://plotcon.plot.lyS 📣
Crypto Plotly @CryptoPlotly
4 Followers 20 Following Interactive plotly charts with most recent data about #Bitcoin, #Ethereum and other cryptocurrencies.


Emmanuelle Gouillart .. @EGouillart
3K Followers 638 Following Scientific director of Saint-Gobain Research Paris Also open-source and scientific Python (scikit-image, plotly)
Гг @plotly_
14 Followers 0 Following
Siddharth Sahasrabudh.. @PlotlyAnalytics
0 Followers 3 Following
Plotly png @PlotlyP82263
0 Followers 0 Following