Search results for #matplotlib

Spectral Rings Made with #python #numpy #matplotlib #sympy and #noIA . . . #arttosell #mathart


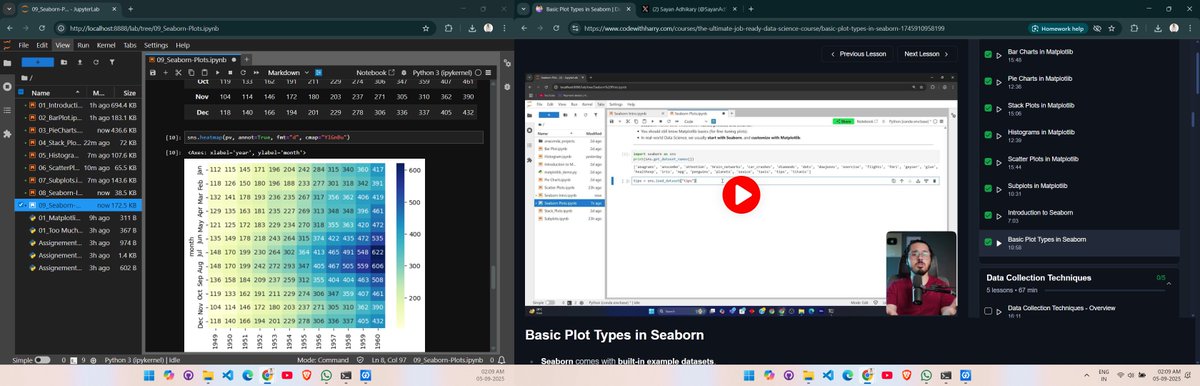
Day 11 ✅ Ending Data Visualization with @codewithharry Learned Matplotlib pie, stack, histogram & scatter plots 📈 basics of Seaborn 🎨 Data becomes more meaningful when it’s visualized💻 #Day11 #DataScience #Matplotlib #Seaborn #LearningJourney

📊 Master Python Data Science Libraries! ✍️ Registration Link: t.ly/NPM-10SE 📅 Start Date: 10th September 2025 🕢 Time: 7:30 PM (IST) #NumPy #Pandas #Matplotlib #PythonProgramming #DataScience #Django #MachineLearning #DataAnalysis #DataVisualization

Day 10 ✅ Started Data Visualization with @codewithharry 📊 Learned Matplotlib basics – plotting charts, bar📈 Data becomes more meaningful when it’s visualized 🎨 #Day10 #DataScience #Matplotlib #LearningJourney

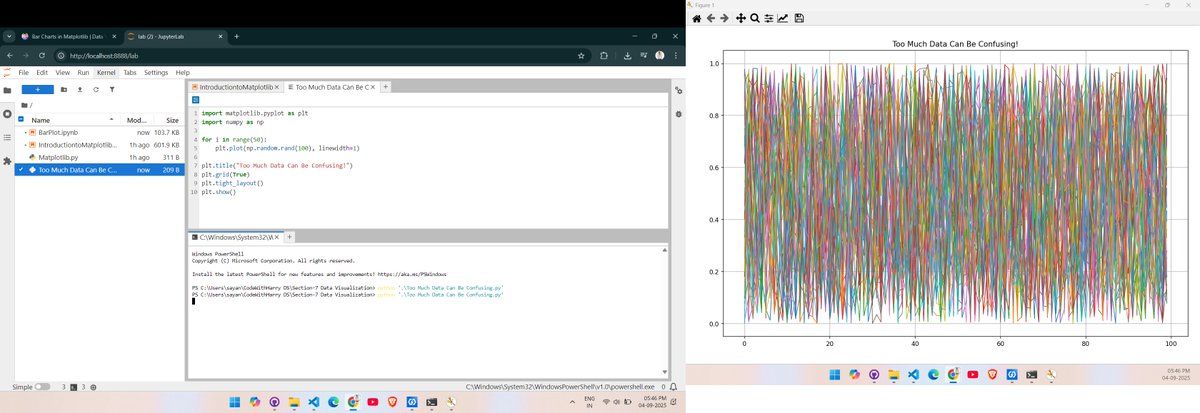
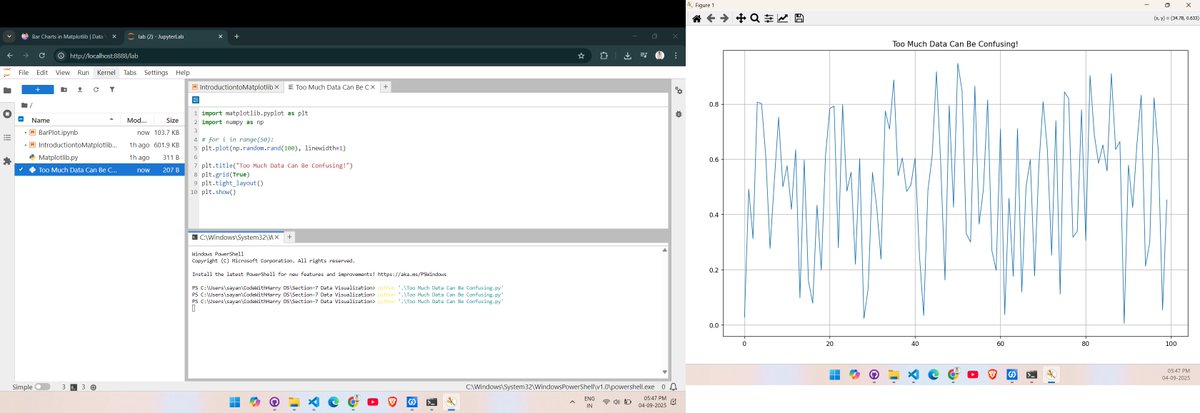
While learning Data Visualization with @codewithharry 📊, I found this interesting: Plotting 50 random lines = chaos 🤯 Plotting 1 line = clarity ✅ Too much data can confuse, but the right amount tells the story! #Day10 #DataScience #Matplotlib #LearningJourney

Day 26 Continued Python practice, started Data Visualization tools lesson in Matplotlib 📊, and made progress in IBM Big Data course 📚. #Python #Matplotlib #BigData #IBMSkillsBuild #DataScience #MachineLearning #AI #Coding #Programming #LearningJourney


【Matplotlib基礎|🍙】 figure+axes vs subplot 👉 figure+axesは柔軟に複数描画、subplotは手早い分割向き! 記事はこちら👇 pythondatalab.com/matplotlib-fig… #Python #Matplotlib #比較解説
【棒グラフ|🌅】 「bar/barh」はカテゴリ比較の定番。積み上げ棒で構成比も一目瞭然! 記事はこちら👇 pythondatalab.com/matplotlib-bar… #Python #データ可視化 #Matplotlib
Made with #python #numpy #sympy #matplotlib #arttosell


Day 22/60 of the @geeksforgeeks #skillupwithgfg challenge! From tables to tales! 📊 Dived into Data Visualization with Matplotlib today. Learned to build histograms, box plots, and more to finally SEE the story in the data. #DataStorytelling #Python #Matplotlib #nationskillup


Plot Satellites’ Real-time Orbits with Python’s Matplotlib #Python #Matplotlib #Space #Data #Visualization plainenglish.io/blog/plot-sate…

Master Python from basics to data science! From syntax & control flow → functions → Pandas, NumPy & Matplotlib #Python #Coding #DataScience #MachineLearning #AI #Programming #DevCommunity #Pandas #NumPy #Matplotlib #BigData #Analytics #PythonTips #DataVisualization


📊⌨️ ¡Con el taller de Ciencia de Datos continuamos con el tercer día del seminario de #IA! Durante el taller, impartido por el Dr. Eric Castro de @SUNEO_UNSIS, desarrollamos competencias para analizar datos con herramientas como #pandas y #matplotlib para la toma de decisiones.


There are better diffusers than QRDs! See the paper: The optimization of profiled diffusers Article in The Journal of the Acoustical Society of America · May 1995 DOI: 10.1121/1.412972 by Trevor John Cox researchgate.net/publication/25… #python #matplotlib #acoustics #diffusion #QRD


Registration for UpSkill Cohort 2 is open. To register, use the link: bit.ly/genesysupskill #GenesysUpSkill #UpskillCohort1 #14DayChallenge #Day7Challenge #DataVisualization #Matplotlib #Seaborn #Plotly


Invitation to the Dance. Who knew that high school mathematics and python programming could be romantic? Animation: Python Music credit: von Weber (1786-1826): `Invitation to the Dance` op. 65., Orch. version Berlioz. Conductor: Karajan: #python #animation #matplotlib

📊 Chart layout woes? The real time-killer isn't design—it's manually aligning multiple plots! 😫 Meet patchworklib: A puzzle-like assembler for matplotlib/seaborn/plotnine plots. Use | and / to snap charts together! 🧩 #Matplotlib open.substack.com/pub/pythonlibr…

Matplotlib @matplotlib
44K Followers 115 Following Python library for creating static, animated, & interactive visualizations. Chat w/ us @ https://t.co/QDNR5Khj9w Sponsored by @NumFocus
数学GIF画像bot @_math_gif
11K Followers 11K Following 数学のGIF画像botです。 プログラミング初心者の中の人が趣味でPythonのmatplotlibで作ってます。GIFのネタはDMでも募集中。 #数学GIF しばらくの間もおそらくこれからも手動ツイート&手動フォロバ
matplotlib.eth @obtodicyp199046
2 Followers 0 Following ✏️Covering the Solana ecosystem • nnI Write Threads

matplotlib.eth @Matplotlib81153
0 Followers 0 Following
matplotlib.eth2637 @eth263770324
1 Followers 0 Following Buy the Ticket, Take the Ride! Together we can do great things. nnDigital Artist, Developer, Father, Friend, Weekend Warrior, and Avid Outdoorsman.nn
matplotlib.eth443 @eth44397435
1 Followers 0 Following a metamedia studio | @PROMETHEUS_I0 | @DAvE_I0 | @SCI_C0RP | @ECHOCORE_PROJ

matplotlib.eth @Matplotlib37092
0 Followers 0 Following
matplotlib.eth @Matplotlib55115
4 Followers 5 Following pronouns: JPEG/GIF I like to edit shit I invest in random shit I do some research I’m usually fucked at the end.

ss @matplotlib766
1 Followers 5 Following
matplotlib.eth @Matplotlib51086
0 Followers 0 Following Builder of Afflux. Co-funder of TowinDAO. ADAMeta Product Manager . All in Web3. 0x966E00c4892d01b720E6E4f68D6c9d8e98de42eB
matplotlib.eth @Matplotlib71983
0 Followers 0 Following

matplotlib.eth @Matplotlib86325
1 Followers 7 Following
YutaKa @801YutaKa108
2K Followers 600 Following 月間10万PVのPythonブログ「YutaKaNotebook」の管理人😋本業はエネルギー業界でデータ分析をしています。TwitterはPython、PC作業効率化、英語学習など、役立ち情報を気ままにつぶやきます。データ分析に必須なMatplotlibやpandasをわかりやすく解説したPythonブログはこちら↓
竜泣 @ryuchan_cry
2K Followers 324 Following AWS EC2 / cloud9, Google drive / spreadsheet / Colabo / Charts, python, matplotlib, Google blogger API v3, Twitter API 日経先物オプション集計中 バグが無いとも限りません参考程度にどうぞ
Vincent Cresto @Matplotlib225
0 Followers 1 Following
Pybonacci 🏳️�... @Pybonacci
5K Followers 260 Following Python científico en español: NumPy, SciPy, matplotlib y más. ¿Quieres colaborar? ¡Escríbenos! Mucho buen humor :) @[email protected]

Krauser @Matplotlib49456
0 Followers 2 Following


Python Guides @pythonguides
2K Followers 2K Following Learn Python, Training, Machine Learning, Artificial Intelligence, Tkinter, NumPy, Django, Matplotlib, Scipy, Pandas, Turtle, PyTorch, Scikit-Learn, Tensorflow
Son of a corner @sonofacorner
8K Followers 245 Following Trying to help people learn more about @matplotlib with football (soccer) data. Donations: https://t.co/dSttGWtRJV
matplotlib numpy @numpyMat
1 Followers 26 Following
Pawel Jastrzebski �... @pawjast
2K Followers 481 Following Data analyst with 🐍 | Turning data to 🖼 with @matplotlib and @inkscape | Sharing tips on data analysis & coding | Learning Flask and Linux - Let's connect🌍
matplotlib.eth ❤️... @Matplotlib29162
0 Followers 17 Following
Hannah @story645
2K Followers 2K Following studying cs/viz/@matplotlib @CSCUNYGC and @CityCollegeNY, like to ♥️ tweets. @[email protected], @story645.bsky.social
Xlabel sur Matplotlib @Tracir_de_Fa
53 Followers 671 Following J'aime les trains ! Vive les trains !
matplotlib @Grooffyyy
0 Followers 24 Following
chiko @lazy_chiko
1K Followers 355 Following I plot data /// my genesis collection “Useless” 🔳 - 1024 generative art pieces created using @matplotlib. Art talk Interview: https://t.co/R4VUFBJMsA
mplsoccer_dev @mplsoccer_dev
3K Followers 1K Following mplsoccer developer @numberstorm. sharing new updates and your ⚽ viz using @matplotlib https://t.co/t9rSBppTX0
casualfantasyfootball... @casualfantasypl
1K Followers 536 Following 🧠 Casually using stats to help you make informed Fantasy Premier League decisions. 📊 🐍 -Python -MatplotLib

Raymond Ding @rrding1995
57 Followers 30 Following Former mathematician ‖ Occasional data scientist ‖ Part-time FPL player ‖ Full-time Mancunian * (all charts created using Matplotlib unless otherwise stated)
Daniel Banas @DanielBanas_sk
317 Followers 195 Following EU citizen from Slovakia, showing ugly data in nice charts #family #rowing #datascience #matplotlib #pandas
Phil Elson @pypelson
517 Followers 261 Following Proud parent of conda-forge, cartopy, Iris and 2 real-world kids. Former Au Pair of matplotlib. Working on accelerator controls at CERN. @pelson.bsky.social
matplotlib.eth @Master_00gwei
182 Followers 541 Following Panik Analyst for gabagoogle, metasaurus, and airBNBinance.
Kellen D Lawson @kellen_lawson
293 Followers 281 Following NPP Fellow @NASAGoddard. Studying exoplanets and circumstellar disks with high-contrast imaging. Fan page for matplotlib and serif typefaces. He/him.
danzn1 @danzn1
3K Followers 888 Following Python 🐍 Matplotlib Bender. highlight-text. plottable. ⚽- analytics and visualizations. VfL Bochum Stats @VfL_Stats 🧠Not very neurotypical 🌱Plant-Based