Search results for #ggplot

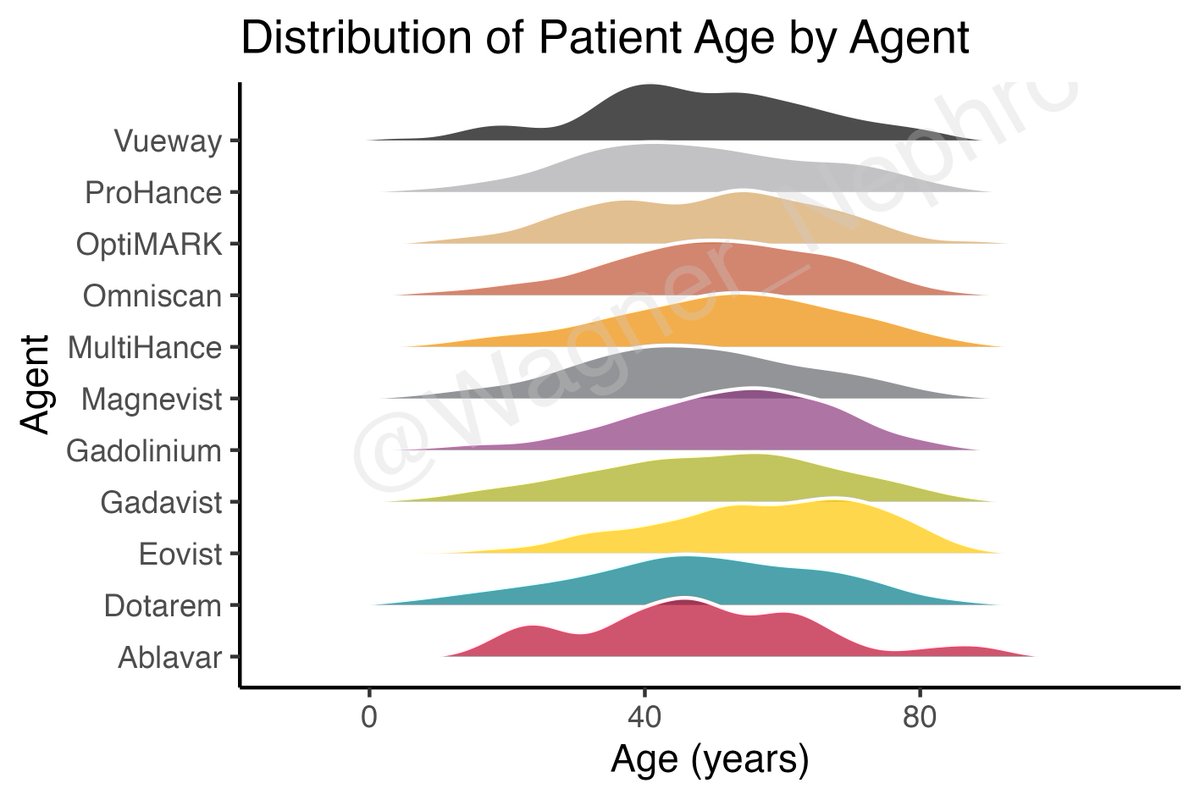
MRI contrast agents and reported adverse events from FAERS (duplicates removed). Age trends visualized with #ggplot ridge plots. #Rstats #pharmacovigilance #FDA

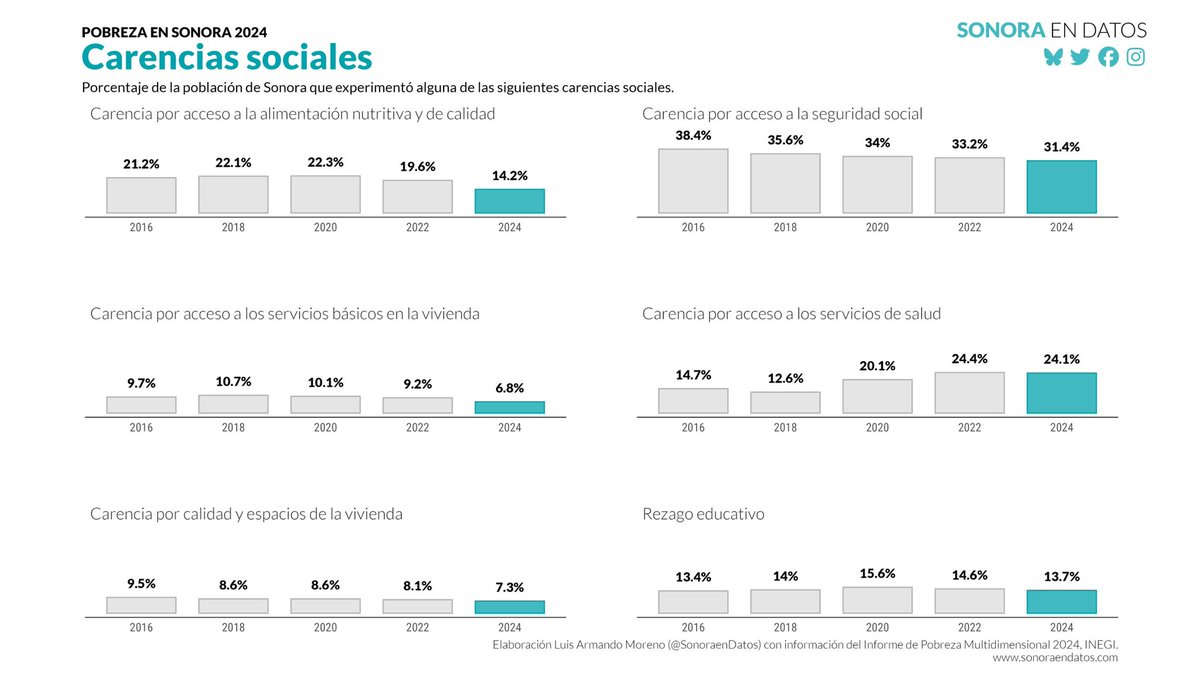
En 2024, 14.1% de los sonorenses carecían de acceso a una alimentación nutritiva y de calidad, 5.4 puntos porcentuales por debajo del registro de 2022 (19.6%). Resultados de carencias sociales en #Sonora según #Pobreza2024 de @INEGI_INFORMA #SonoraenDatos #rstats #ggplot


I visualize trends in #ICE #immigration arrests and encounters over time and across select US cities using public data from deportationdata.org/data/ice.html Here is the #RStats #ggplot code so you can visualize the #dataviz trends in your own city: gist.github.com/JEFworks/0c76f… #codetutorial
I use #ggplot #gganimate #Rstats to visualize spatiotemporal trends in public ICE detention data Watch ICE detention increase over time: more detainees (bigger dots), more non-criminals (blue → red), and more jails popping up inland in 2025 Code #gist: gist.github.com/JEFworks/899a1…

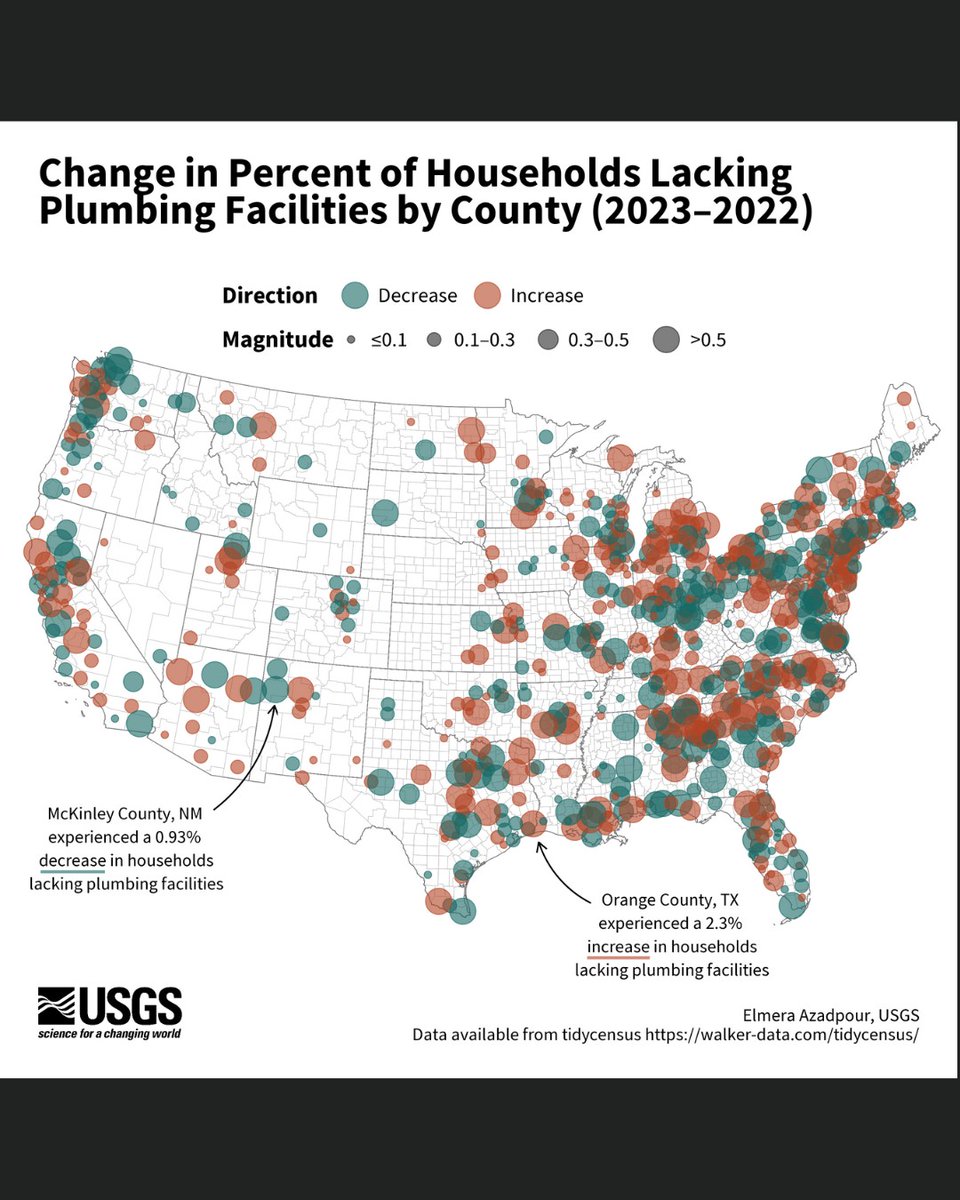
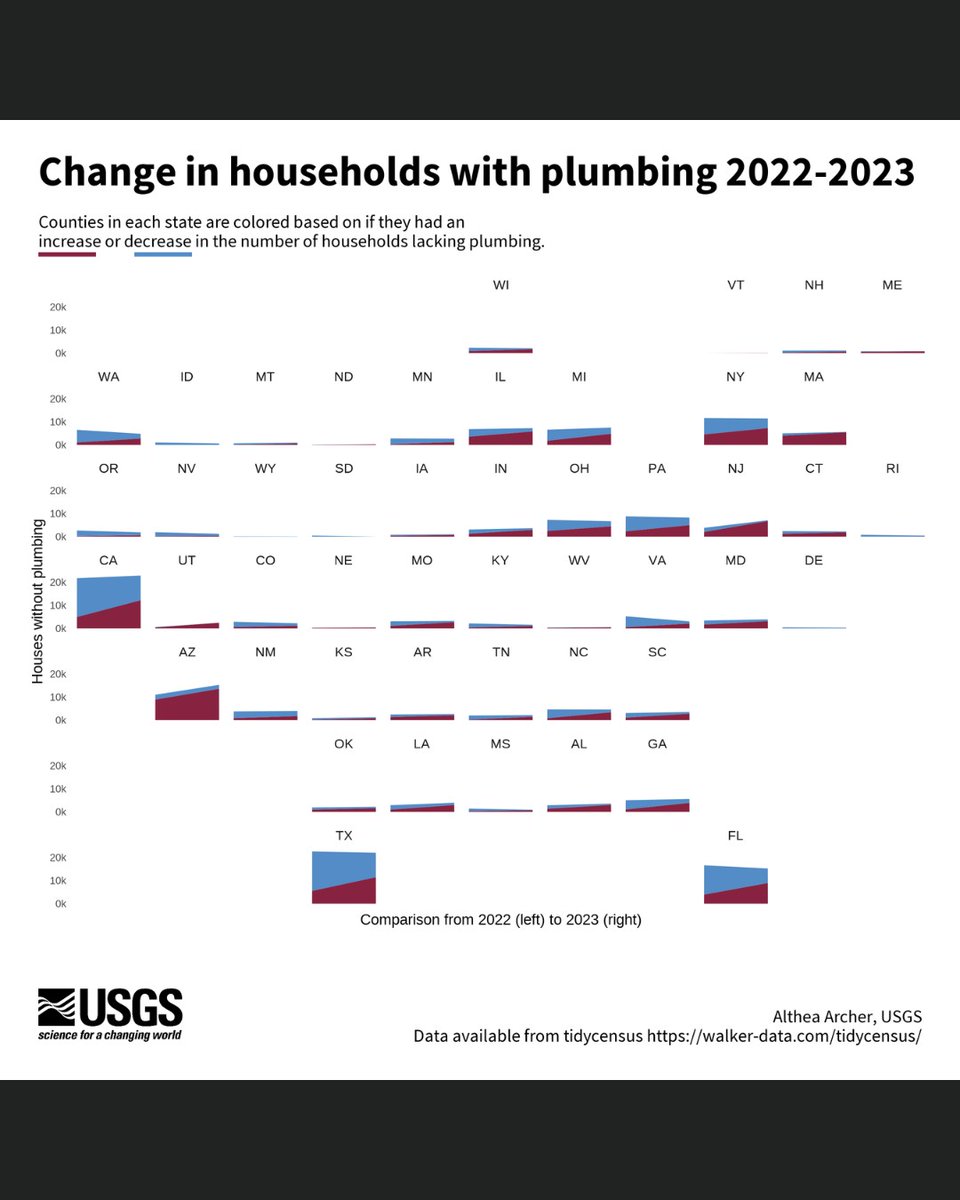
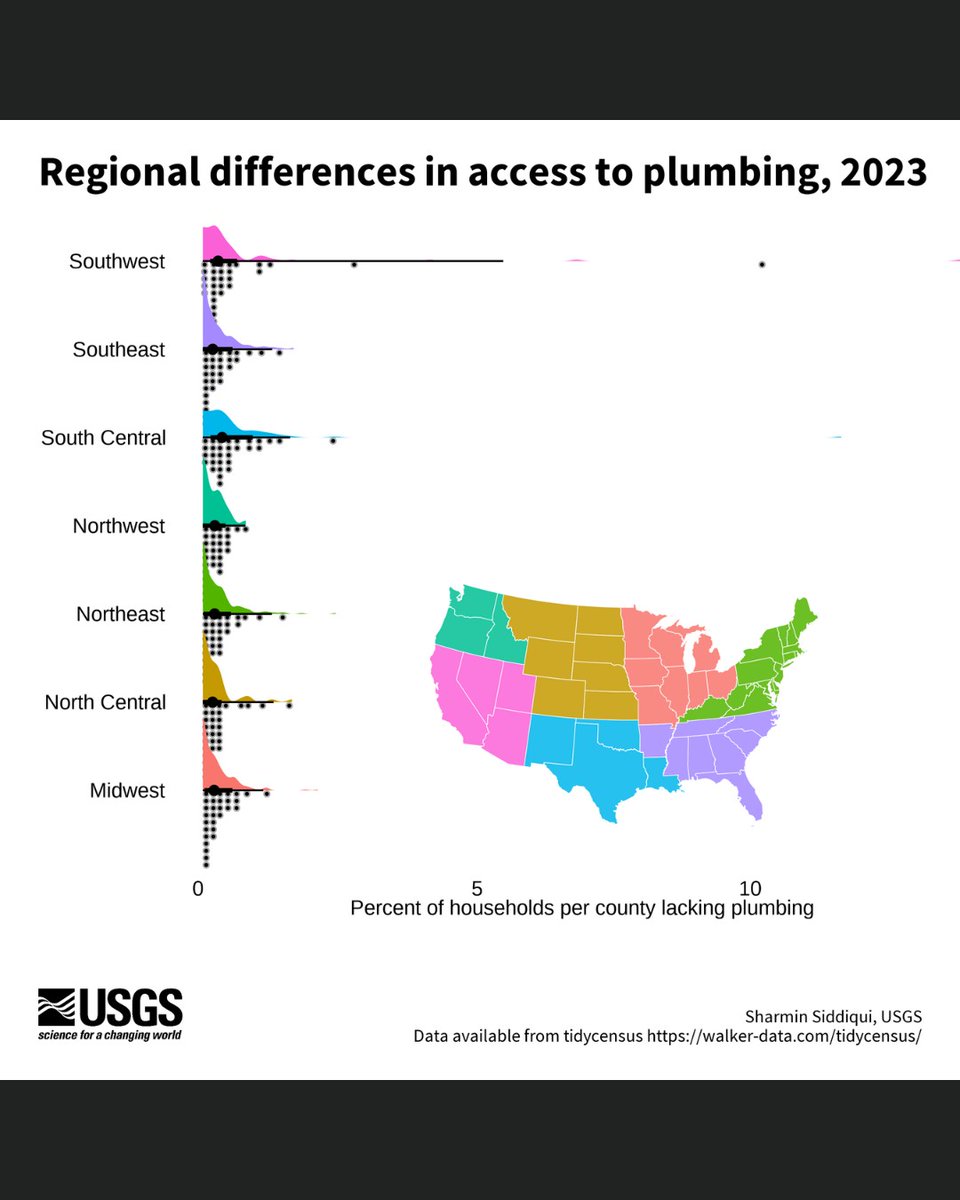
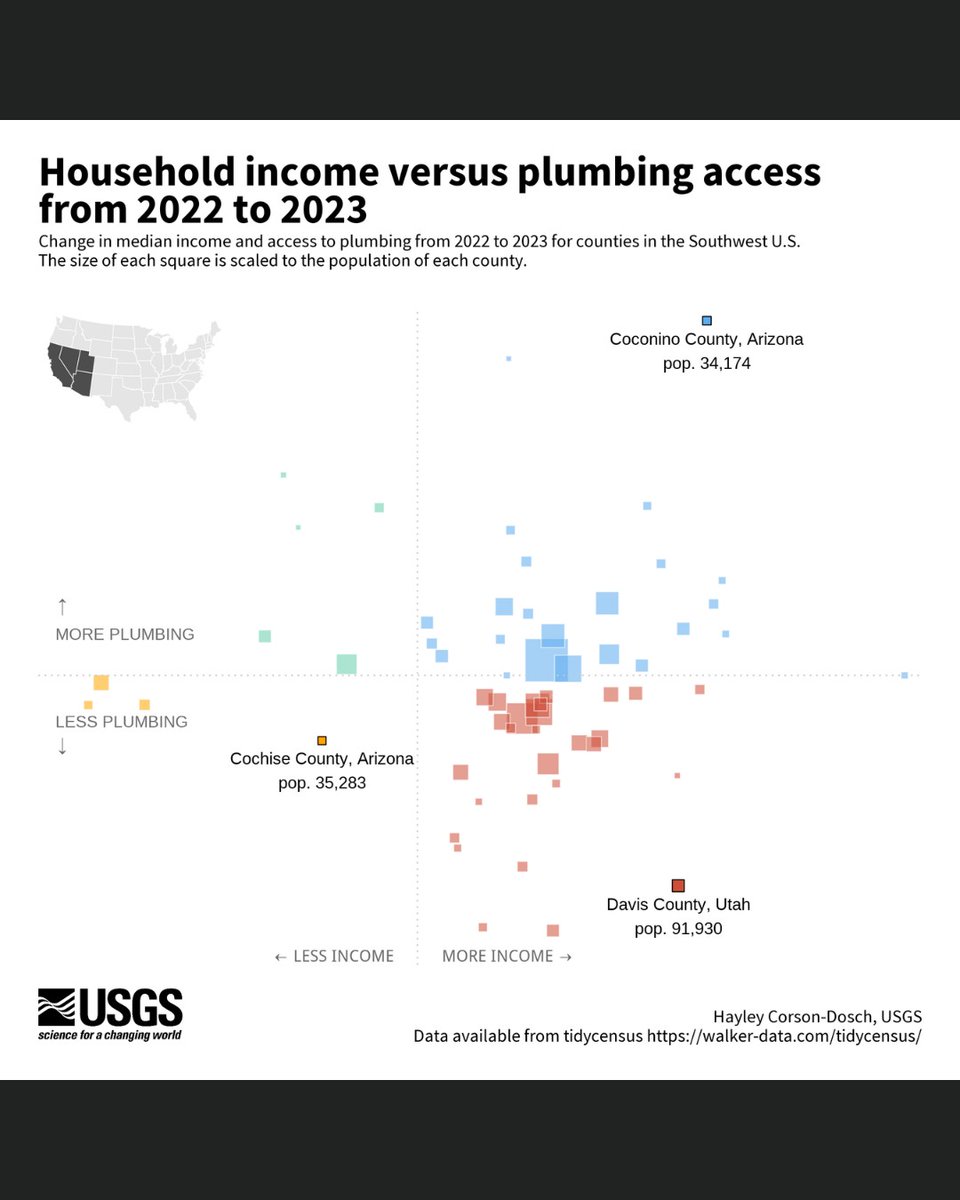
🎉 New blog alert: Charting #tidycensus data with R Using data from the #USCensus, we created a series of graphs looking at access to plumbing across the U.S. #tidytuesday #reproducible #Rstats #ggplot ow.ly/LKs150WisJr

#statstab #350 Communicating causal effect heterogeneity Thoughts: Cool guide on properly communicating uncertainty in effects. #bayesian #uncertainty #ggplot #r #brms #tidybayes #heterogeneity vuorre.com/heterogeneity-…

New content to my recently launched course: "Healthcare IT Decoded – Data Visualization using R"! Reuse your ggplot2-based R code in Python Enroll using the discounted link valid till 05/15/2025 6:00 PM IST udemy.com/course/healthc… #datavisualization #Python #ggplot #plotnine


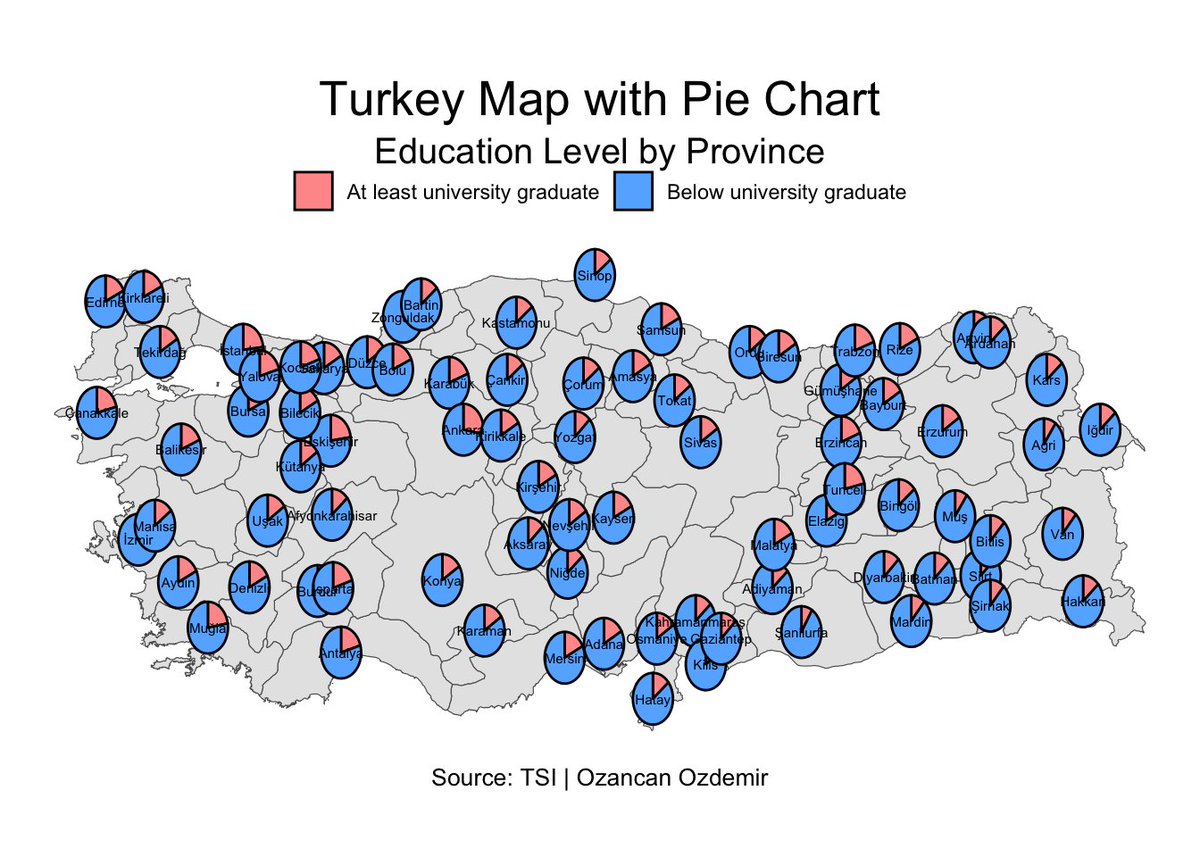
R programlama dilinde, haritaların üzerine pasta grafiklerini nasıl ekleyebileceğinizi gösteren bir öğretici hazırladım. #Rstats #dataviz #ggplot ozancanozdemir.github.io/map_and_piecha…


#TidyTuesday viz attempt on visualising the rescue operations of Long Beach Animal Shelter. -> Encouraging to see the numbers go up after a COVID-19 decline. -> Cats are the most rescued animals followed by Dogs. Ambhibians being the rarest. #geom_waffle #rstats #ggplot


Another submission for #week5 of #DuBoisChallenge2025 #Rstats #ggplot #DataViz
My submission for #week5 of #DuBoisChallenge2025 #Rstats #ggplot #DataViz

Another submission for #week4 of #DuBoisChallenge2025 #Rstats #ggplot #DataViz
This week's #TidyTuesday visualisation allowed me to explore the uneven distribution of the NIBRS adoption across the various US agencies. There appeared to be a clear pattern where agencies in a handful of states were lagging behind. #Rstats #Rstudio #ggplot #dataviz

My submission for the #week4 of #DuBoisChallenge2025 #Rstats #ggplot #DataViz

Submissions for #week3 of #DuBoisChallenge2025 #Rstats #ggplot #DataViz


データ追加しました。 障害者虐待防止法の通報件数と認定率の年次推移(2025年2月)|naruhisa nakane @naruhisa007 #note #tidyplots #ggplot #R note.com/naruhisa007/n/…


Sotero Salazar Ana Ka... @ggplot2_lech
53 Followers 3 Following
ggplot2 @ggplot22
13 Followers 0 Following
Ana Karen Sotero Sala... @ggplot_lech
8 Followers 3 Following
ggplot2 @ggplot23
3 Followers 1 Following
ggplot2 @ggplot25
26 Followers 145 Following
ggplot2 @ggplot2
116 Followers 14 Following
Gabrielle Doran @ggplot_gabby
15 Followers 23 Following i'm not like a regular nerd, i'm a cool nerd #datascience #statistics #r #sql #python
George Garcia III @ggplot_3
31 Followers 82 Following First gen PhD student in economics @MIT, interested in culture, political economy, and inequality
GG @ggplot_20121
19 Followers 185 Following
GgplotR @GgplotR
3 Followers 6 Following

qibin guo @ggplot_1
0 Followers 0 Following
ggplot1 @ggplot111
0 Followers 0 Following
ggplot @ggplot8
0 Followers 0 Following
ggplot @ggplot5
0 Followers 0 Following
GGPlotDontLie @GGPlotDontLie
0 Followers 0 Following
GGPlot Bot @GgplotB
0 Followers 0 Following
Ggplot @Ggplot13351
1 Followers 9 Following

ggplot @ggplot13575y
0 Followers 1 Following
Ggplot @Ggplot6
0 Followers 1 Following
ggplot @ggplot19
0 Followers 1 Following
ggplot30 @ggplot3084394
0 Followers 1 Following
ggplot_40 @40Ggplot84088
0 Followers 1 Following
정동철 @ggplot
3 Followers 32 Following
g gp lo t @ggplot117033
0 Followers 2 Following
해석 손 @ggplot9799
0 Followers 2 Following
abu s @ggplot82
0 Followers 2 Following
ggfdrr @ggplot18rr
0 Followers 2 Following

Gretchen Kioschos @ggplot00
2 Followers 50 Following
ggplot @KunYi50071
0 Followers 3 Following
ggplot @ggplot79716935
0 Followers 4 Following
Inès @ggplot99
0 Followers 4 Following
임정 @ggplot_belle
0 Followers 4 Following

Ggplot @Ggplot226
0 Followers 5 Following
삵 @ggplot221122
0 Followers 5 Following
ggplot @ggplot7
0 Followers 6 Following
ggplot @lnlo_ln1
0 Followers 7 Following

Jo Herbert @micro_jo
548 Followers 637 Following Postdoctoral Researcher studying Anaerobic Environmental Microbes using Long-read Sequencing | ETH Zürich | 🧬 🧫🧪🔬| losing the ggplot 📊 | she/her
ggbob @ggplot20
3 Followers 21 Following
c l @ggplot222
0 Followers 57 Following