
Philipp Koytek @p4dataviz
▪️◾️◼️⬛️ Data Visualization: Enthusiast | Designer | Engineer ⬛️◼️◾️▪️ Joined November 2017-
Tweets40
-
Followers75
-
Following149
-
Likes276
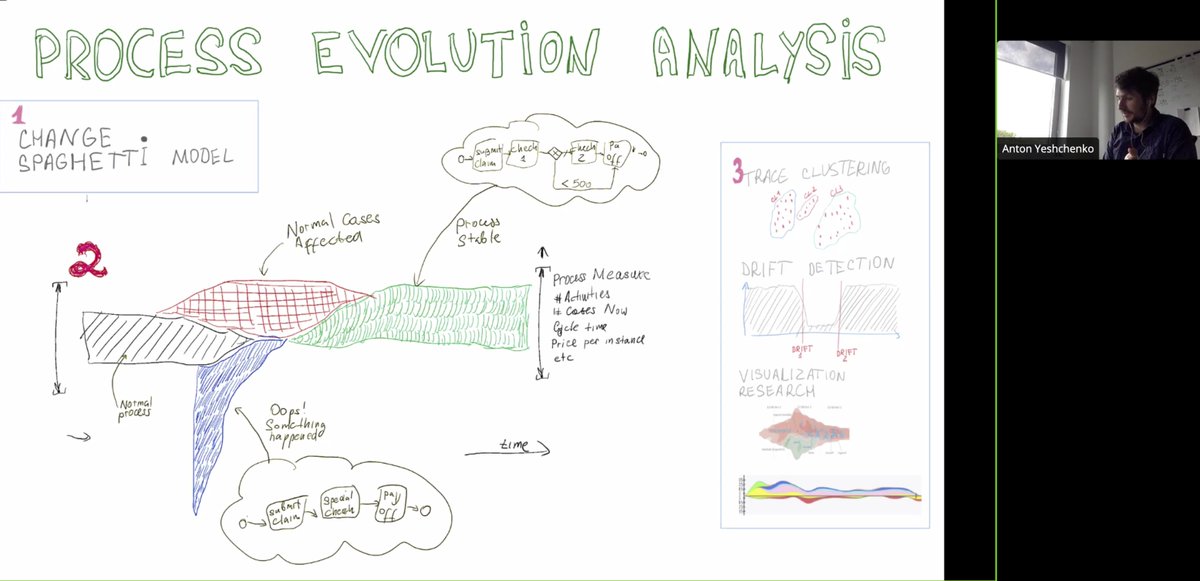
Let’s review this chart. I understand they wanted to use a „filling up the pipeline metaphor“ but the area chart above is hard to interpret and adds little value like this, I find. Issues: vertical, non-linear time axis, slope is meaningless. What do you think? #dataviz

Let’s review this chart. I understand they wanted to use a „filling up the pipeline metaphor“ but the area chart above is hard to interpret and adds little value like this, I find. Issues: vertical, non-linear time axis, slope is meaningless. What do you think? #dataviz
Finally, we made it: A video how to configure charts in Celonis Studio. Woop woop! :D Very excited to have this and be able to refer users to a resource. Stay tuned for cool features in the future ;) 🎬 Check it out: lnkd.in/efiWgFwA Thanks, Ji…lnkd.in/e8qNVhpF
A nice video of visualizations we are building! Here in the spotlight: the Process Explorer. Are you interested to bring process visualizations to the next level with us? reach out me! We are looking for you! #dataviz #engineering #hiring lnkd.in/enKW4C4T
In the #dataviz team at @Celonis, we aim to implement user-friendly charts, and sometimes art happens. We call it "whale". Also, we are looking to grow our data viz team in PM, UX, and Engineering. Take a look: celonis.talentry.com/list/9bu8d718o… #applynow #datadesign #visualization
This looks great and is so much needed! Finally thorough guidance on accessibility specifically targeted at data viz! Thanks @FrankElavsky for sharing 🙏
This looks great and is so much needed! Finally thorough guidance on accessibility specifically targeted at data viz! Thanks @FrankElavsky for sharing 🙏

Explore our program in detail and prepare for virtual attendance as our virtual #ieeevis conference site goes live! virtual.ieeevis.org
An exciting project ends and a new exhibition starts: Starting today for the next ten years @Celonis technology can be explored by visitors to the Deutsche Museum in Munich! I am proud of having contributed to an interactive module featuring a guided tour of Process Mining!
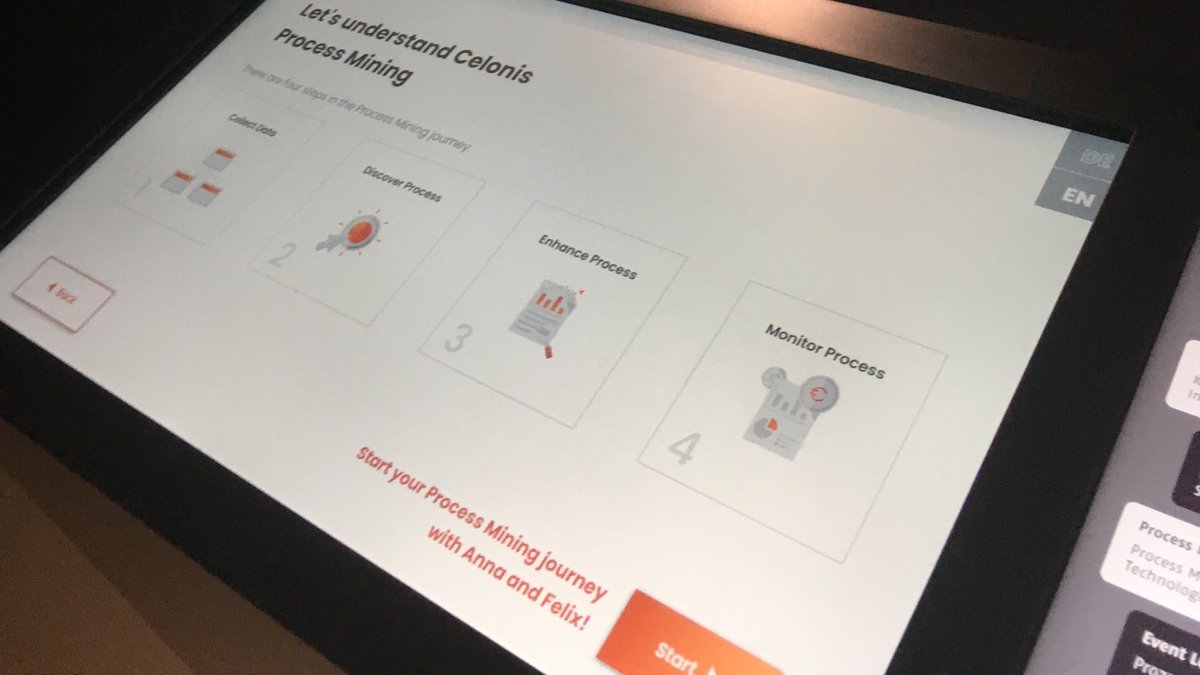

An exciting project ends and a new exhibition starts: Starting today for the next ten years @Celonis technology can be explored by visitors to the Deutsche Museum in Munich! I am proud of having contributed to an interactive module featuring a guided tour of Process Mining! https://t.co/UPUf7qd3c5

It’s the details that make an analysis meaningful and exciting to use. Learn Celonis Data Visualization Best Practices for free 🎓🚀 #datavizualization
Cool idea paper at @CAiSEConf by @AntonYeshchenko on visualizing the evolution of business processes over time: ncbi.nlm.nih.gov/pmc/articles/P… Session: "Process models and visualizations" Would love to see more interaction examples between the #processmining and #dataviz communities.
Since colors are one of the most effective tools in data visualization, we made a new #dataviz color palette @Celonis that balances data viz best practices with company brand identity: medium.com/celonis-engine…
Tomorrow starts #CelosphereLive ! With over 15k attendees it will be the largest conference centered around process mining, analytics and operationalizing process optimization. Join to see our latest product advancements incl. process visualizations.
Tomorrow starts #CelosphereLive ! With over 15k attendees it will be the largest conference centered around process mining, analytics and operationalizing process optimization. Join to see our latest product advancements incl. process visualizations.

Listening to talks at @TheFrontConf today. Quite nice saturday afternoon activity. Like TV but with learning 😄

Listening to talks at @TheFrontConf today. Quite nice saturday afternoon activity. Like TV but with learning 😄

Kudos for this great example of how to drive for more diversity!

Kudos for this great example of how to drive for more diversity!
Great thread with links to available datasets.

An interactive and explorative cardboard marvel! (~english: As a ranger you need to get high above, ... know your way around, ... and look very closely ... to ever spot a snow leopard.) @WWF_Deutschland

The Trump administration is moving at breakneck speed to open the Arctic National Wildlife Refuge — the last great stretch of nothingness in the United States — to oil exploration. @henryfountain and @SteveEder give us the unforgettable story. nyti.ms/2Rwj1tt

New episode out today! Check out Peak Spotting, @moritz_stefaner & team's new vis for the German railway, and then listen to our latest for a behind-the-scenes look at how they made it. Listen at bit.ly/2DA5i0A .
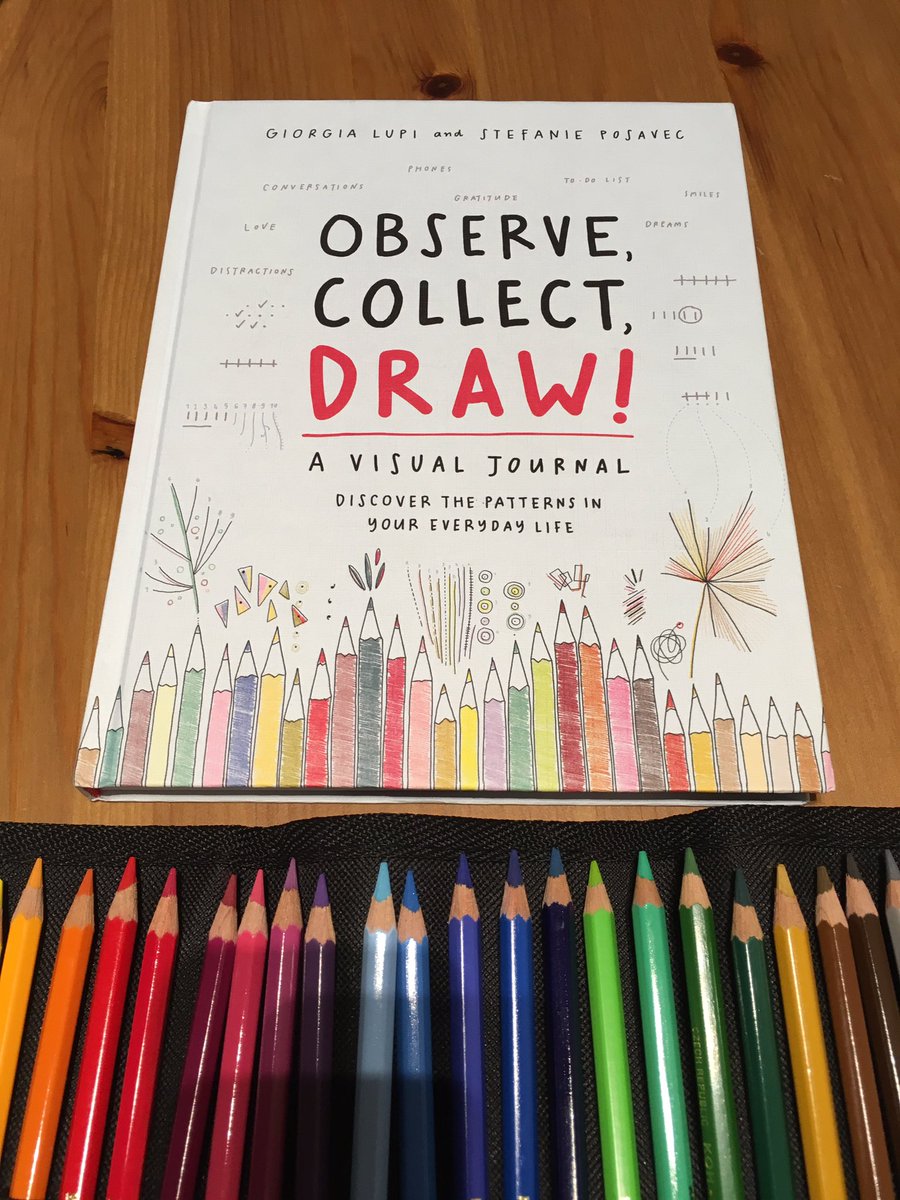
Get the crayons out! First page done, looking forward to some fun and creative data drawing. #observecollectdraw by @giorgialupi and @stefpos


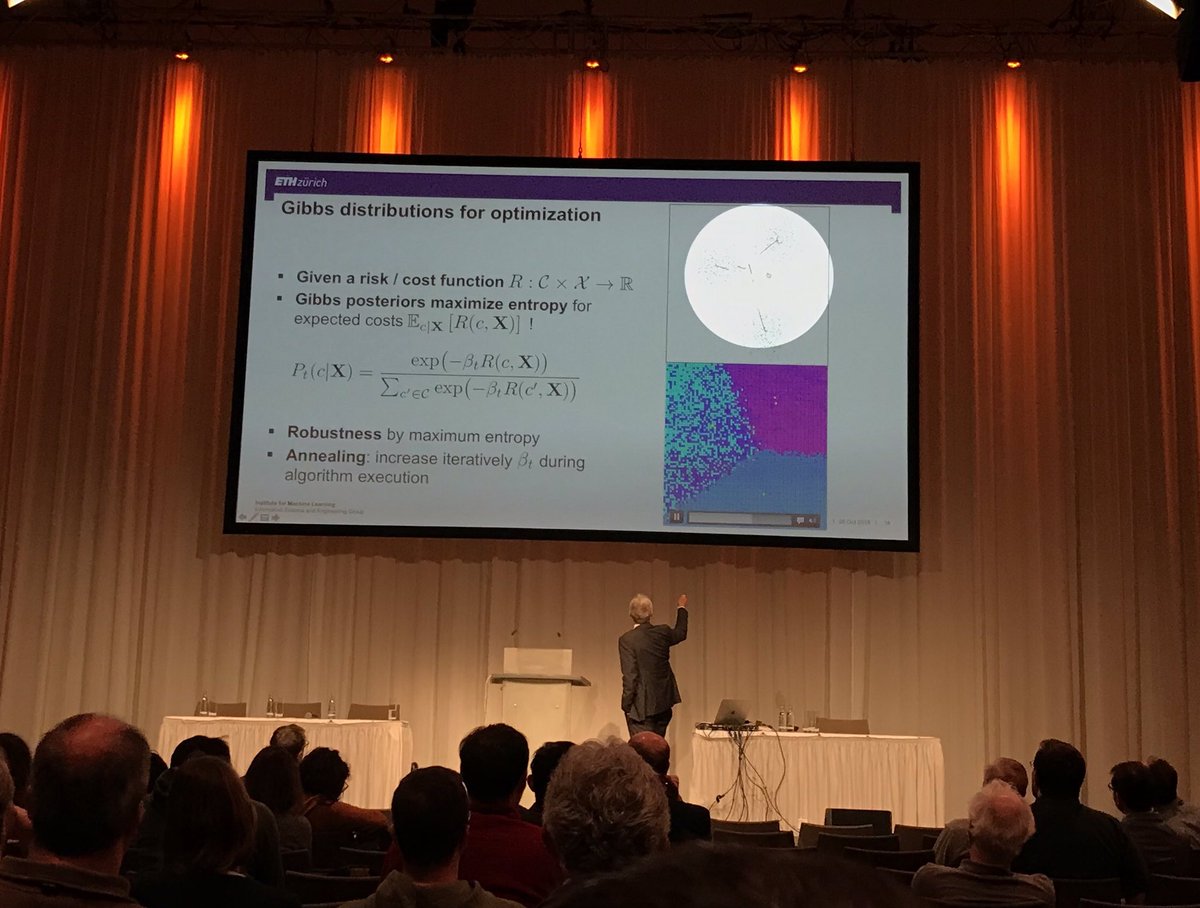
In case you were wondering, I think Joachim M. Buhmann is using a Logitech Spotlight remote: logitech.com/en-us/product/… #ieeevis

Ashish @tulsani1
929 Followers 3K Following Data, Digital, Analytics and Insights | Exploring AI Agents | Responsible AI | Random Posts
Mathieu Dataviz @mathieudataviz
132 Followers 494 Following Data Visualization Freelance, crafting #dataviz with creativity. Full stack, #dataengineer #datascientist. Exploring #data for fun and clients projects.
Simon Kuestenmacher @simongerman600
258K Followers 216K Following German #geographer and #demographer in #Melbourne. I curate #maps and #data that explain how the #world works. Obviously all opinions are my own...
Yanhong Lu @iyanhonglu
2 Followers 22 Following Hey everyone, I'm Yanhong! Passionate about all things data. Love visualizing findings & diving into interpretation within a logical framework. #DataEnthusiast
Paleblue. @palebluenews
48 Followers 201 Following World news from a global perspective. Formerly @heatmapnews
Quantize Analytics @qntznyltcs
535 Followers 3K Following #Tableau Consulting for #Finance, #Sales and #Marketing
Uta Hinrichs @uta_ente
642 Followers 453 Following

Maria Ruehringer @mariaruehringer
706 Followers 755 Following - https://t.co/jUAyk4uyB5 - Tweets on geospatial, Cartography, DataViz and travelling 🗺 🇳🇱 🇦🇹 Views my own. RT ≠ endorse

Natalia Kiseleva @eolay13
905 Followers 243 Following engineer. love dataviz & dataart. I like programming and draw comics!
Alex Kolokolov @KolokolovAlex
414 Followers 660 Following Data2Speak Inc Founder. I’ve been helping businesses turn complex reporting systems into professional management tools for 13 years
Nadia Fankhauser @nadiafank
800 Followers 2K Following InfoVis & Visual Analytics lover, librerías, cocinas del mundo y mejorar mis preguntas. Pinto datos en @elartedemedir
Laura Araujo @Lauaraujo
350 Followers 226 Following Design and system thinker who cares about UX, team building, and worthwhile digital products • She/her/latinx • Lead UX Designer @Celonis •
Sabrina Ebitsch @sebitsch
790 Followers 980 Following #ddj- und andere digitale Projekte im @SZ-Datenteam
Vanessa Fillis @FillisVanessa
360 Followers 909 Following data visualisation specialist @f_l_o_u_r_i_s_h // previously BBC England Central News Service // @BCUJournalism alumni

Martina @martina_dossi
843 Followers 282 Following #dataviz enthusiast | graduated in statistics @UniPadova | working as data scientist @PrometeiaGroup | Behance: https://t.co/Srkp8IGdnE

Natalia Render @GriestNatalia
210 Followers 1K Following
Vizzu @VizzuHQ
1K Followers 1K Following Our team puts 50 years of dataviz craft into an animated slide deck you present just like PPT. You guide the clicks; the story moves the room.
䆣 @wang_design
68 Followers 2K Following
Andreas Ellwanger @ndrsllwngr
141 Followers 1K Following Software Engineer @Celonis | I love Rust + Java, React | CS @LMU_Muenchen. Past Aiderly, @UniLeiden & part of first cohort of @Tech4Germany — Views my own.

Hal9 @hal9ai
723 Followers 576 Following Create and Share Powerful AIs #ChatGPT #ArtificialIntelligence #MachineLearning #Python

Natalie Zuieva @NatalieZuieva
59 Followers 305 Following Freelance Infographic Designer based in Kyiv, Ukraine

Kay Ayala @Kay_Ayala_
102 Followers 1K Following Data Scientist at Luxoft. Interested in quality global education and climate change.
Dataviz Doctor @datavizdoctor
9 Followers 97 Following Ask me anything about #dataviz, I will be happy to search for an answer.
David Ledo @DavLedo
563 Followers 278 Following 🇻🇪🇨🇦 Sr. Research Scientist @Autodesk. Formerly @MSFTResearch intern @Ucalgary Computer Science PhD. @[email protected]
Cockpit.com 👨🏻�... @cockpit_com
4 Followers 164 Following Everything is a plane. Instruments for growth. Good data.

Lee Feinberg @DecisionViz
1K Followers 4K Following We build leaders in the next wave of data visualization: the people, process, and culture to accelerate decision-making and action-taking.
Leonardo @Leonardonclt
2K Followers 945 Following Data and visual investigations at @BBGVisualData @business. Creator of https://t.co/z93KsZ9B4o Opinions are my own. AI/Tech tips are welcome.

Astacus_A @AstacusA
2 Followers 59 Following
Frederic Fery @fredffery
3K Followers 4K Following #tableau Ambassador | 7x #VOTD | Viz 👉 politics, sport, Aussie social issues | #VizforSocialGood Director | Brisbane TUG Leader | 🇫🇷 in 🇦🇺
Laksara Abeysinghe @danupalaksara
11 Followers 82 Following started studying Bachelor of Science Hon's Degree( Applied Statistics) at South Eastern University Of Sri Lanka.
Kuhu Gupta @thekuhugupta
286 Followers 1K Following Data Visualization Engineer and Designer @illumio | From Sketches to JavaScript | I Help Organizations Build Actionable Data-Driven Experiences. 📊
TLF Research @TLFResearch
3K Followers 4K Following tweets about customer experience, links to articles & case studies from the UK's leading customer research provider
Wonjun Kim @Wonjun20529
2 Followers 5 Following

DataFest Tbilisi @DataFestTbilisi
1K Followers 1K Following We organize the greatest data festival on the crossroads of Europe and Asia! Join us and help us spread the love for data!
Courtney Hilton @CourtneyHilto16
100 Followers 2K Following Professional rider.❤ My WhatsApp +1(832)382-7864

Luc Guillemot @Luc@vi... @lucguillemot
706 Followers 965 Following visualization engineer @datawrapper — previously @funkeinteraktiv @IXT — 🏃 — He or They 🏳️🌈 Mastodon: @[email protected]
Ghulam Jilani Quadri @jiquad
337 Followers 538 Following Assistant Professor @UofOklahoma, @ENGINEERINGatOU | Prev: @unccs, @usouthflorida | InfoVis, Design Optimization, HCI | #firstgen
Samuel Huron @cybunk
2K Followers 3K Following Moving to : https://t.co/jN7D1DvTES / Prof. #Design #Dataviz #ux #délibération at @IP__Paris @TelecomParis
OutlierConf @OutlierConf
4K Followers 570 Following This account is inactive. Follow @DataVizSociety for Outlier Conference updates.

Erik Escoffier - @ner... @nerik
2K Followers 740 Following FIND ME ON BSKY OR LINKEDIN - Maps, dataviz, climate, energy, oceans, forests ❈ dataviz engineer @octopusenergy ❈ Founder https://t.co/vZJakZq7M4
The Legendary FloorCh... @FloorCharts
11K Followers 3K Following Dedicated online archiver of charts, props and posters from Congress & WH. Bsky/Instagram/Substack: @FloorCharts
Uta Hinrichs @uta_ente
642 Followers 453 Following
Natalia Kiseleva @eolay13
905 Followers 243 Following engineer. love dataviz & dataart. I like programming and draw comics!
André Kohn @ankohn
111 Followers 63 Following
Michael Hladky @Michael_Hladky
11K Followers 283 Following Trainer and consultant @PushBased #Angular @NxDevTools #rxjs #webperf #TypeScript #GDE #MVP, creator of #RxAngular
Maria Ruehringer @mariaruehringer
706 Followers 755 Following - https://t.co/jUAyk4uyB5 - Tweets on geospatial, Cartography, DataViz and travelling 🗺 🇳🇱 🇦🇹 Views my own. RT ≠ endorse

Krist Wongsuphasawat @kristw
3K Followers 1K Following Data Experience @airbnb / Prev: Data Visualization @twitter • Data Vis research @UofMaryland HCIL • From @Thailand / My Tweets are my own.
Bundeskanzler a.D. Ol... @KanzlerScholz
971K Followers 128 Following Archiv-Account. Europäer. Demokrat. Für #Respekt und eine starke #Demokratie. Former Federal Chancellor https://t.co/IUiGhTawb4

Sen. Bernie Sanders @SenSanders
11.8M Followers 2K Following Sen. Sanders of Vermont, Ranking Member of U.S. Senate Committee on Health, Education, Labor & Pensions, longest-serving independent in congressional history.
Nic Marquardt @nicmarquardt
1K Followers 1K Following Principal Researcher in Human-Computer Interaction & Generative AI at Microsoft Research
Questions in Dataviz @questionsinDV
392 Followers 122 Following New book for 2022 from @theneilrichards - Questions in Dataviz, based on the https://t.co/sOlvzvZDlQ blog. Stay tuned for updates!
Midjourney @midjourney
401K Followers 0 Following A community supported research lab - exploring new mediums of thought and amplifying the imaginative powers of the human species.
無異 @taekie
9K Followers 1K Following pxd의 UXtech Lab을 운영하며 정보디자인을 합니다. Information Design + Problem Solving + Prototyping.
Laura Araujo @Lauaraujo
350 Followers 226 Following Design and system thinker who cares about UX, team building, and worthwhile digital products • She/her/latinx • Lead UX Designer @Celonis •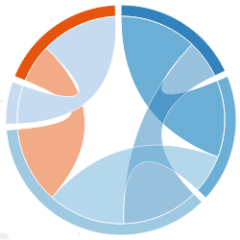
D3.js Community @d3visualization
11K Followers 494 Following We ♥ D3.js. Official #D3js community account. Curated by Christophe Viau
Raphaël Benitte @benitteraphael
1K Followers 317 Following creator of https://t.co/CkULD6PIx8 & https://t.co/HYb8XxAS9t
Funke Interaktiv @funkeinteraktiv
2K Followers 94 Following Funke Interaktiv regularly publishes applications, graphics, maps and storytelling formats @FunkeBerlin. Formerly Berliner Morgenpost Interaktiv.
Jon Mease @jonmmease
886 Followers 219 Following Creator of @vegafusion_io, acquired by @_hex_tech. @vega_vis Altair co-maintainer. Former Chief Scientist at @plotlygraphs
VegaFusion @vegafusion_io
287 Followers 6 Following Server-side scaling for Vega and Altair visualizations Sponsored by @_hex_tech
Sabrina Ebitsch @sebitsch
790 Followers 980 Following #ddj- und andere digitale Projekte im @SZ-Datenteam
Marie-Louise Timcke @datentaeterin
5K Followers 650 Following Ressortleitung @SZ Datenjournalismus, vorher @funkeinteraktiv | Trainer @journocode | (she/sie)
RAWGraphs @rawgraphs
7K Followers 1K Following A free and open source tool and framework to visualize data by @densitydesign, @studiocalibro & @inmagiklabs
Krisztina Szűcs @szucsi
5K Followers 414 Following https://t.co/hAZGXA6Utq • Data Visualization Designer • Experimental projects at https://t.co/YuB3h3GWk3 • occasional UX Designer

Yan Holtz @R_Graph_Gallery
22K Followers 676 Following Software engineer who ❤️ #dataviz. Creator of https://t.co/sj29jZPkYr and the R, Python, D3 and React graph galleries. ➡️ https://t.co/PoJNeHXz8a 📈 🌊 🍺
Matthias Stahl 🇪�... @h_i_g_s_c_h
5K Followers 4K Following Husband & dad^3 ||| head of data & visualizations @derspiegel ||| #Svelte and #D3 ||| computational biology PhD ||| 🇸🇪🇩🇪🇪🇺 ||| opinions my own
Mark Hintz @MarkHintz
465 Followers 696 Following Software engineer building queries, widgets, and dataviz at @datadoghq — previously @zhdk design student, coder @IXT and @periscopic
Lionel Radisson @MAKIO135
19K Followers 2K Following Classic generative weirdo. SVG wizard 🧙♂️ @[email protected] | https://t.co/kzgnyHEq9L | @CreativeCodeLY he/him
r/DataIsBeautiful @DataIsBeautiful
55K Followers 1K Following Daily tweets about beautiful data visualizations from r/DataIsBeautiful
Martina @martina_dossi
843 Followers 282 Following #dataviz enthusiast | graduated in statistics @UniPadova | working as data scientist @PrometeiaGroup | Behance: https://t.co/Srkp8IGdnE
Cédric Scherer @CedScherer
25K Followers 2K Following Inactive account → find me on BlueSky and LinkedIn 🧙♂️✨📊 Independent #DataViz Consultant & Designer 👨🎓🌿🐗 PhD in Computational Ecology
Mike Freeman @mf_viz
4K Followers 925 Following Data Visualization Software Engineer: working to make visualization more accessible, equitable, and impactful. Views are my own. He/him.

NZZ Visuals @nzzvisuals
11K Followers 1K Following Visual Journalism | DDJ | EdTech | OSINT Das Visuals-Team der Neuen Zürcher Zeitung @NZZ Wir sind auch auf BlueSky: https://t.co/YauVqoBhuL
Valentina D'Efilippo @defilippovale
6K Followers 1K Following Award winning data designer #TheInfographicHistoryoftheWorld #PoppyField #Oddityviz #Metoomentum #LondonUnderTheMicroscope #GuardianClasses #DomestikaCourses
DataFest Tbilisi @DataFestTbilisi
1K Followers 1K Following We organize the greatest data festival on the crossroads of Europe and Asia! Join us and help us spread the love for data!
Frank ⌁ @FrankElavsky
5K Followers 2K Following 📊 data interaction, visualization, accessibility tools+systems @cmuhcii | disabled++ | making a ttrpg | breaking rules | ⚑ anti-fascist, anarchist | elsewhere
Cockpit.com 👨🏻�... @cockpit_com
4 Followers 164 Following Everything is a plane. Instruments for growth. Good data.
Fil @ https://bsky.ap... @recifs
3K Followers 2K Following https://t.co/UgBUZeDqFu (Previously: Vocateur. Data, maps & journalism https://t.co/Rkqi2Ij05j https://t.co/cvjCNIsDeQ @[email protected])

Jan Willem Tulp @JanWillemTulp
13K Followers 1K Following Datavizioneer @ TULP interactive @tulpinteractive.com on BlueSky @[email protected] https://t.co/1jegKuDIQq https://t.co/opOLGmCwV7
Plot + Scatter @plotandscatter
183 Followers 162 Following Data analysis, UX, & UI. We transform data for human consumption. [email protected]
ellie @ellieup
6K Followers 888 Following
Eva Murray | @evamurr... @TriMyData
19K Followers 947 Following Lead Evangelist @snowflakeDB & Career Coach for women in data 👩🏻💻 • Tweets and threads about career development and public speaking.
Ian Johnson 🔬🤖 @enjalot
8K Followers 2K Following Member of Technical Staff @orbitalmaterials 💾 @observablehq, @google, @lever https://t.co/fuEQttdsY0
Sam Parsons @SParsonsDataViz
6K Followers 1K Following Biztory: https://t.co/mnjU9EJ4x9 | Tableau Visionary & former Zen Master | Iron Viz '21 Global Runner-up | Views are my ownTrends for United States
You might like