Explore Explain | A Video & Podcast Series @Explore_Explain
Andy Kirk’s 📺+🎧 long-form conversations with data visualisers to explore their design process and explain the hidden stories behind their brilliant work visualisingdata.com/podcast/ Your ears or eyes Joined January 2020-
Tweets630
-
Followers3K
-
Following1
-
Likes52
Final mention for this brand new episode about the values that motivate and guide a dataviz studio, @beyond_wrds. 📺youtube.com/watch?v=oBAWGF… 🔗visualisingdata.com/2024/04/explor…
Final mention for this brand new episode about the values that motivate and guide a dataviz studio, @beyond_wrds. 📺youtube.com/watch?v=oBAWGF… 🔗visualisingdata.com/2024/04/explor…
If you run a data viz studio, work in one, want to work with one, want to start one, or work with studios as partners, this will be an enlightening 60 mins of your time with the brilliant Rebecca and Duncan of @beyond_wrds
If you run a data viz studio, work in one, want to work with one, want to start one, or work with studios as partners, this will be an enlightening 60 mins of your time with the brilliant Rebecca and Duncan of @beyond_wrds
NEW EPISODE: Season 5 Episode 1 of 'Explore Explain', a 📺 🎧 series of long-form data visualisation conversations. In this season opener I chat with Rebecca & Duncan from @beyond_wrds about the importance of a studio culture shaped by strong values. visualisingdata.com/2024/04/explor…
New #dataviz training course scheduled! 👨🏼🏫'Masterclass in Data Visualisation' 🏫Classroom-based, central London 🗓️ 10-11 July, 9:30am-5pm each day 💳Early bird rates until 10 May 💷2 places available on ‘pay what you can afford’ basis visualisingdata.com/2024/04/new-co…
With my transcripts submitted for the 3rd edition of my book, I'm now switching to updating my training materials to reflect the latest content, ideas, and examples. This course will be the first opportunity to share all that.
🎟️Limited number of places remain for this month's 'Masterclass' training in London. 💷 One final place available on 'pay what you can afford' basis. 🗺️There's a change of venue, new details in the post (less than a mile from original). visualisingdata.com/2024/02/new-co…
🎟️Limited number of places remain for this month's 'Masterclass' training in London. 💷 One final place available on 'pay what you can afford' basis. 🗺️There's a change of venue, new details in the post (less than a mile from original). visualisingdata.com/2024/02/new-co…
Tomorrow I'm publishing the 2nd issue of my 'Visualising Data Newsletter' with 50 great visuals, learning resources, news, and other sundries encountered during February all packaged into a neat email. Still chance to sign up visualisingdata.com/newsletter/
Had a lovely chat with Rebecca and Duncan from @beyond_wrds for episode 1 of the new - FIFTH! - season of ‘Explore Explain’ which will be published and released later this month. Brilliant guests, could have continued the conversation for hours. visualisingdata.com/podcast/

Happy Season 5 Eve to all who celebrate! I look forward to recording the first episode tomorrow, featuring Rebecca and Duncan from @beyond_wrds. We could arguably chat for days about all sorts of topics but we’ll be exploring life running a studio and the values that guide them
Happy Season 5 Eve to all who celebrate! I look forward to recording the first episode tomorrow, featuring Rebecca and Duncan from @beyond_wrds. We could arguably chat for days about all sorts of topics but we’ll be exploring life running a studio and the values that guide them
Subscribers remain the priority recipients. However as some people evidently have technical restrictions preventing sign-up for emailed newsletters, I'm going to publish a web version, 2 weeks later, for those who miss out on. Here's Issue #1 from Feb. visualisingdata.ck.page/posts/issue-1-…

I've set up a dedicated web page for my Newsletter. Includes info about what to expect, how to subscribe and [delayed] links to web-versions each issue. visualisingdata.com/newsletter/

New #dataviz training course scheduled! 👨🏼🏫'Masterclass in Data Visualisation' 🏫Classroom-based, central London 🗓️23-24 April, 9:30am-5pm each day 💳Early bird rates until 22 Feb 🫰🏼2 places available on ‘pay what you can afford’ basis visualisingdata.com/2024/02/new-co…

Nadieh Bremer @NadiehBremer
48K Followers 579 Following Data Visualization Artist (+ graduated Astronomer ✨) with a love for Data & Generative Art | 🇳🇱 https://t.co/2QeuXCOGlo
Alberto Cairo @AlbertoCairo
68K Followers 5K Following For news, follow me on BLUESKY: https://t.co/nN8zwUEmZs and LINKEDIN: https://t.co/BV7fInzN6w
John Burn-Murdoch @jburnmurdoch
491K Followers 6K Following Columnist and chief data reporter @FinancialTimes | Stories, stats & scatterplots | Senior fellow @LSEdataScience | [email protected]
Andy Kirk | Visualisi.. @visualisingdata
57K Followers 1 Following Independent data visualisation expert: Designer, consultant, trainer, lecturer, author, speaker, host of ‘Explore Explain’ series. *Cross-posting*
Matthias Stahl 🇪�.. @h_i_g_s_c_h
5K Followers 4K Following Husband & dad^3 ||| head of data & visualizations @derspiegel ||| #Svelte and #D3 ||| computational biology PhD ||| 🇸🇪🇩🇪🇪🇺 ||| opinions my own
Alli Torban @AlliTorban
9K Followers 988 Following 📕 Author of Chart Spark 📊⚡Information Designer and Senior Data Literacy Advocate 🎙 host Data Viz Today podcast
Lisa Charlotte Muth @lisacmuth
35K Followers 729 Following Formerly @lisacrost. Creating & writing about dataviz for @datawrapper. #visber & @datavisclub organizer. Also over there: @[email protected]
Evelina Judeikytė @parabolestudio
4K Followers 1K Following Data storytelling for mission-driven orgs 🎯 Founder of Parabole Studio 📡 Learn data storytelling with me 👉 https://t.co/fVmB5ujjCI
Cole Knaflic @storywithdata
35K Followers 775 Following Helping people create graphs that make sense, present powerfully. CEO & author of #daphnedrawsdata, #storytellingwithyou, #SWDbook & #SWDletspractice!
Cédric Scherer @CedScherer
26K Followers 2K Following 🧙♂️✨📊 Independent #DataViz Consultant & Designer ♢ PhD in Computational Ecology ♢ #rstats #ggplot2 #figma ♢ #graphics #maps #ddj #design ♢ he/him
Voilà: Francis Gagno.. @chezVoila
3K Followers 1K Following Now on BlueSky | Information design studio focused on sustainable development. Since 2013. Gold @ Info is Beautiful Awards. Tweets by FG, founder.
Neil Richards @theneilrichards
8K Followers 1K Following Tableau Visionary Hall of Fame & Public Ambassador | Global Data Fluency @JLL | https://t.co/q1nvEnM4QD | Questions in Dataviz book released Nov 2022
Amelia Wattenberger �.. @Wattenberger
31K Followers 5K Following design, LLMs, web dev, data viz, tools for thought ✨ R&D @GitHubNext, previously design @AdeptAILabs
@[email protected].. @JanWillemTulp
14K Followers 1K Following Hello, I create data visualizations @ TULP interactive - https://t.co/opOLGmCwV7 upcoming course: https://t.co/1jegKuDIQq @[email protected]
Alex Selby-Boothroyd @AlexSelbyB
21K Followers 5K Following Head of data journalism at The Economist. I ❤ charts
Wendy Shijia @ShijiaWendy
6K Followers 2K Following Data visualization designer, Tableau Visionary & Tableau Public Ambassador
ZACH @ZachBowders
8K Followers 658 Following Data + Love Podcast | Tableau Visionary & Ambassador | Dataviz Maverick

Moritz Stefaner @moritz_stefaner
20K Followers 2K Following Crafting data experiences at https://t.co/1OMc7l9A96 / Podcast @datastories / Mastodon https://t.co/ZLcsQpK88Y
Kevin Flerlage @FlerlageKev
17K Followers 3K Following Tableau Evangelist/Data Visualization Consultant at Moxy Analytics | 5X Tableau Visionary | 5X Tableau Public Ambassador | One Half of the Flerlage Twins
Heather Garcia @HeatherGar35664
0 Followers 4 Following

CRG Solutions Pvt. Lt.. @CRGSolutionsIND
394 Followers 2K Following #CRGSolutionsIND is #Services Provider. We are a #business consulting firm. #Certified Partner & Implementer of #Tableau #Alteryx #Engage #Datawatch #Atlassian
Mary Green @MaryGreen977566
1 Followers 5 Following
Stephanie Lee @Stephan40175470
0 Followers 5 Following
Angela Scott @AngelaScot62780
0 Followers 4 Following
Yun Wang @wyunnn
424 Followers 705 Following Senior Researcher @MSFTResearch AI-Powered HCI & VIS. 👀Human+AI on Visual Design/Creativity/Communication/Analysis. CS PhD @VisLab_HKUST
Christina Flitton @ChristinaF11483
0 Followers 4 Following
Mary Rowe @MaryRowe73940
0 Followers 4 Following
Daniele Testa @danieletesta
659 Followers 2K Following I'm a Frontend Dev at @AccentureSong 🌈 with a passion for CSS and JavaScript adventures. Making websites less weird, one line of code at a time
Emily Clough @emily_clough_
333 Followers 836 Following Head of Data Investigations at @Global_Witness (she/her) Trustee at @ScotswoodGarden and @RFUK Previously at @NclPolitics Tweets my own
Harrison Wedel @HarrisonWedel
77 Followers 567 Following maker of nice looking things, lover of data viz, admirer of corgis. he/him
Tony Barada @tbarada1
110 Followers 973 Following

Joanna Papageorgiou @stillawake
9K Followers 10K Following Mother of two. Zen Buddhist. 🇬🇷🇦🇺 talking about a revolution, sounds like a whisper. UWE & OU student
Chris Knox @vizowl
2K Followers 2K Following Head of Newsroom Data @nzherald | Interested in all the ways data can be used in journalism | tools are #rstats, #d3js and #sveltejs | @[email protected]
Marcelo Duhalde (马�.. @mduhalde96
3K Followers 2K Following Information designer & Illustrator. Living and loving in Hong Kong


Guan Sang @Guansang
49 Followers 141 Following
BWAMBALE ISAAC KHAN @DrIsaacKhan
2K Followers 4K Following C.E.O RYHE |KIU_Student | Medicine |HR, Climate Activist | Mentor |AYLF Leader| UWONET Peer Educator | Analytical Phlegmatic | Great Future Husband and Dad
Erran Su @ErranSu
267 Followers 2K Following Passionate and talking about: Data Visualisation & Design 📊🎨 Advanced Analytics in Marketing & Finance 🏆 Artificial Intelligence 🎎
Ben Mayhew @experimental361
42K Followers 862 Following Football analysis & visualisations with an @EFL bias. Former Head of Data Analysis @PA. Lapsed astrophysicist. @TUFC1899 fan. 🇺🇦
Jeremy Wilmer @JeremyWilmer
141 Followers 269 Following @[email protected] (Mastodon handle) Faculty @Wellesley. Founder of https://t.co/Jr7iVVRV06. Co-leader of https://t.co/Z76sk12IXw and https://t.co/xqOMZDyJDx projects.
Ogaal @OgaalSO
0 Followers 130 Following Fresh dose of selfless news in the spirit of the blessed revolution 🗞️ “Somalia’s paper of record” - President Siad Barre
Lisi Müller @_lisimuller
31 Followers 71 Following Exploradora de dados e histórias | Em busca de conexões entre o passado e o digital 🌍💀💻 #Bioarqueologia #Comunicação #Dados . https://t.co/sb7G3tO0HD
Melissa Brown @MelissaBro59533
2 Followers 5 Following
Gina Vipond @GinaVipond43655
0 Followers 5 Following
malik @malikgwandu
15 Followers 238 Following
ComTruize @ComTruize
18 Followers 440 Following
Pierre Smith @PierrePsmith930
11 Followers 17 Following
Misty Alabama @AlabamaMisty
53 Followers 672 Following
White Hill Adventure .. @whitehilladv1
1K Followers 4K Following We offer cheap and best holiday package in Nepal, Tibet and Bhutan. We really care money and value for ours customer. Ours package: Treks,Tours,climbing,safari.
Lotus Finans @LotusFinans
4 Followers 85 Following Değer Katan Bilgi | Güvenilir kaynaklardan sağlanan ekonomik ve finansal içerikleri araştırıp sunuyoruz 🔍
Jonathan Clark @jc6104a
186 Followers 2K Following
Tom Gabriel Johansen @tomhal99
1K Followers 2K Following Husband, dad, designer, drafting author/infoviz ninja of IPCC Special Report on 1.5°C warming, Land report and WG1 AR6.
Markus @MarkusIsSocial
55 Followers 336 Following Digital media designer with a special interest in interactive data visualisation and visual prototyping. Mannheimer, now based in Berlin and London.
Natalia Kiseleva @eolay13
947 Followers 257 Following engineer. love dataviz & dataart. I like programming and draw comics!
Jessica @jessicaruthcur1
267 Followers 463 Following Innovation, System Change, Mental Health Recovery, Wellbeing. Burren fixation.
Jon Baker @jonbaker99
69 Followers 1K Following
Tabrej Alam @alamtabrej07860
3 Followers 38 Following
Mindful Thor @Thor03801139
82 Followers 1K Following
Goran Lonnberg @EpiGlobe
126 Followers 270 Following Statistician, Data Scientist at Epidemiology and Global Health, Umea univ, Sweden
Nod Ulus @nodp53
82 Followers 258 Following
Violet Insight @Violet_Insight
8 Followers 78 Following An Insights Company and a Philosophy In the ever-evolving landscape of market trends and consumer behavior, Violet Insight stands as a beacon of understanding.
Luke Parsons @lukeparsons
73 Followers 789 Following
Andy Kirk | Visualisi.. @visualisingdata
57K Followers 1 Following Independent data visualisation expert: Designer, consultant, trainer, lecturer, author, speaker, host of ‘Explore Explain’ series. *Cross-posting*
Thanks @visualisingdata for giving @mariepastora and me the mic (and great questions) to share our creative process for charting @taylorswift13 's wealth with friendship bracelet beads 🪡🟣🟡🔴🟢🔵🟠〰️
NEW EPISODE: Season 4 Episode 9 of 'Explore Explain', a 📺🎧 series of long-form data visualisation conversations. In this season finale I chat with @ChloeWhiteaker and @mariepastora about their joyous dataviz about @taylorswift13's billionaire status visualisingdata.com/2024/01/explor…

Looking forward to listening to this! Brilliant publication, brilliant podcast, what's not to like?

Totally beyond-excited to have this podcast about Nightingale by the amazing @visualisingdata!!!! visualisingdata.com/2023/06/explor…

.@visualisingdata & @Jasonforrestftw take the stage to talk about the making of Nightingale Magazine, the journal of the @DataVizSociety. Print Issue 3 drops this month! #outlier2023


#outlier2023 The Nightingale story and the vision behind this cool magazine @Jasonforrestftw @visualisingdata


Almost didn’t make it back in time, but we did! Was so excited for this session by @visualisingdata and the Nightingale team! 📕 @Jasonforrestftw @datacitron @ClaireESantoro and Emily Barone


This #outlier2023 session is making me so excited to sit down w/ Nightingale (after I graduate lol) thank you @visualisingdata for organizing I was so excited for it & thank you Emily Barone @ClaireESantoro @datacitron @Jasonforrestftw for this beautiful magazine I’m such a fan💖


Loved hearing more about the team and work behind the fabulous Nightingale print magazine during the @Explore_Explain "podcast" during @OutlierConf (only 4 people in the core team! @Jasonforrestftw @datacitron @ClaireESantoro & Emily Barone 🙌🔥✨) Can't wait for issue 3!


Nightingale, @DataVizSociety, @OutlierConf, @Explore_Explain, all on stage together. The #dataviz world is in good hands. Thanks to all involved with these initiatives for taking our professional discipline and community to a new level. 👏👏👏

It’s @Explore_Explain live at #outlier2023 with @visualisingdata and @Jasonforrestftw (and the rest of the team joining virtually). Looking forward to learning all the behind the scenes tricks and secrets!

Ever wondered how a #dataviz magazine was made? Join us at #outlier2023 to hear @Jasonforrestftw @ClaireESantoro @datacitron and Emily Barone (the #Nightingale team) talk with Andy Kirk (@visualisingdata). Yes, we will have a live recording of the @Explore_Explain podcast!

Andy puts a lot of work in preparing these interviews. There’s a reason why they flow so well and I’m very grateful for his professionalism and expertise, which make me look better than I deserve.
For the third season finale, S3E9 featured a conversation with Francis Gagnon, @chezVoila, as we shifted away from looking at an individual data vis project and instead explored the story behind the founding and growing of the info design company, Voilà:. youtube.com/watch?v=ILLKPH…

Thank you @Explore_Explain for hosting us this episode! 🙌
NEW POST: Season 3 Episode 7 of 'Explore Explain', a 📺🎧 series of long-form data visualisation design conversations. In this episode I chat with @mick_yang and @mooneighrah to learn about a @konti_sg data story about sexual violence in Singapore. visualisingdata.com/2022/07/explor…
Cynics may unfairly think this is a decision made because I'm distracted by thoughts of tomorrow's champions league final and I'm actually watching wall to wall highlights of the season so far.

This new episode with @SParsonsDataViz is just about ready for launch, thanks to the hard work of @MeBethanyAndrew, but I'm going to keep on ice over the weekend and then publish in time for the Monday morning commuters.

Oh I am loving the dramatic music!
Hear some of @SParsonsDataViz highlights ahead of his episode release where we look at his visualisation piece "Rivers of Time", designed for the Tableau Iron Viz 2021 competition. #marvel #dataviz

@Explore_Explain @defilippovale Thank Andy for these great sessions and insights in dataviz projects.
Hooray! Great series.

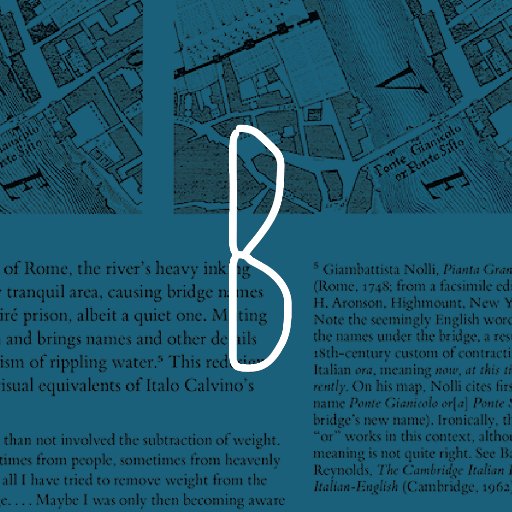
I'm so excited about this interview with @visualisingdata - if you are curious to know more about London Under the Microscope pls share your questions.
On Friday I will be recording a new episode with the amazing @defilippovale to learn more about her project 'London Under the Microscope'. I have a thousand questions to ask her already, but if you want to add to that list, send in any curiosities you'd like to know more about.
I cannot wait! Shame it's virtual otherwise I'd have got @visualisingdata to sign my copy of his book!
Then I will be learning from the mega-talented @SParsonsDataViz about how he designed 'Rivers of Time', his exquisite study of time in the Marvel Cinematic Universe. x.com/sparsonsdatavi…

Woohoo, I can't wait! It's my first time on a podcast and it was so much fun to deep dive into the craft. @visualisingdata is such a great host, I felt at ease throughout the whole interview.
Landing tomorrow, the latest episode of 'Explore Explain' with the excellent @janezhgw! Jane goes deep into the thinking behind her super-nice visual depiction of the 'food her grandmother made'. Project: janezhang.ca/work/the-food-… Podcast info: visualisingdata.com/podcast/
I love this series, what an honour kicking this off 1 year ago!
'Explore Explain' is 1 year old today! And what a year... April 27 2020 we published the first episode starring the might @maartenzam. Thanks to everyone who has listened, watched, shared, and said nice things about this series. We continue with Season 3! visualisingdata.com/podcast/
Trends for United States
You might like